


One consequence of the pandemic lockdown . due to Covid-19 has in some cases been a significant decrease of traffic volumes from vehicles. At some borders, the decrease of personal car traffic was significantly reduced during the lockdowns in the spring of 2020. Since vehicles can contribute to the background electromagnetic interference environment, it is of interest to investigate if the pandemic lockdown has led to any observable differences in measured background electromagnetic interference levels. Measurements have been done in the civilian GPS-frequency band in the vicinity of the bridge over Öresund, between Sweden and Denmark. A significant reduced level of electromagnetic interference can be seen as a result of the lockdown in the spring of 2020. Furthermore, these measurement results indicate that passenger cars have the largest contribution to the interference in the GPS-band.
The use of wireless technologies is constantly increasing in the society . A large variety of applications incorporates wireless technology, in a spectrum from social media applications to more demanding critical applications. Examples of critical applications are in the area of security and safety, machine-to-machine (M2M) communications, automotive applications, banking and financial systems, energy production, transport and logistics. Other specific examples are communication for remote control of trains and for landing and take-off of aircrafts.
The amount of wireless devices has had a tremendous growth the last years and it is foreseen that the number of devices will grow even further with the next generation of mobile systems, self-driving cars and massive Internet of Things (IoT). GPS (Global Positioning System) is another example of wireless service widely used both for positioning, navigation and timing. Since the received satellite signals are very weak, below the normal noise level, all interference in the GPS-band might be critical for this service. To increase the knowledge of interference levels in the GPS-band, a portable measurement system has previously [2] been developed at FOI for measurements 24/7.
It is well known [1] that ground vehicles can produce significant levels of electromagnetic interference in the civilian GPS-band. One reason is that local jammers used in the cars in order to e.g. avoid different tracking services, cause interference at longer distances than just around the car. Measurements have been done during the time period of the pandemic lockdown in the spring of 2021. One measurement location was in the vicinity of the road over the bridge of Öresund between Sweden and Denmark. The measurement period covered the time before and after a larger lockdown of the border traffic in the beginning of Covid-19 pandemic. Therefore, the impact from this lockdown on the electromagnetic interference environment in the GPS-band could be analysed.
Measurement System
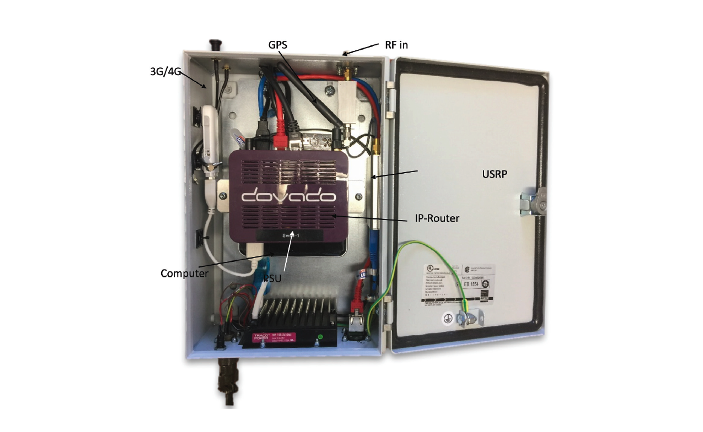
The measurement system is based on a software definied radio (SDR) from Ettus (USRP-B210) used for digitize the RF-signal when an incident is detected. The SDR is connected to a small computer running Linux, a GPS receiver is also connected to the computer to get position and data regarding the current GPS-constellation. For each incident a set of measurements are stored in the computer for off-line analysing later. The measurement system is autonomous and communicates with a central server using wired Ethernet connection or by a 3G/4G modem.
 Measurement Results
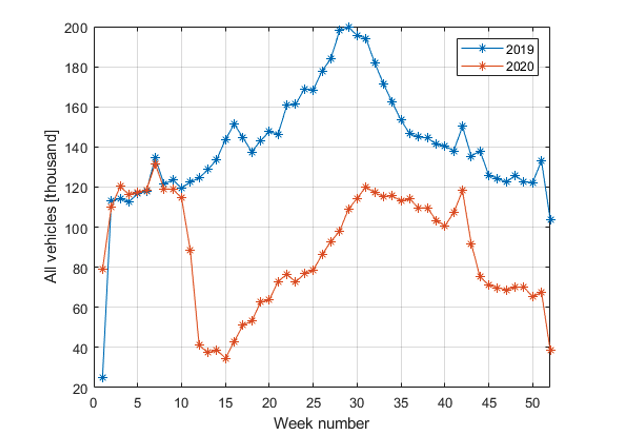
In [3], statistics over the traffic passing the bridge of Öresund are presented. Both monthly and weekly statistics (weekly figures from 2019) of different traffic types are given. The weekly figures are used as an indicator of how covid-19 affects freight and passenger car traffic across the strait [3]. In figure 1 the statistics for the category with all traffic are shown for both 2019 and 2020. The figures shows that the statistic levels for both years are almost the same with start from week 1 until week 10 in 2020. After week 10 in 2020, there is a large reduction from about 120 thousand vehicles down to the lowest level around 35 thousand vehicles at week 15. Also, when comparing the results for week 15 an even larger difference can be identified. Only 25 % of the total traffic 2019 passed the bridge 2020 in the same week. The main reason for the large reduction in traffic is that from the middle of week 11, recommendations, restrictions and measures from the Danish and Swedish authorities due to the coronavirus were tightened. Stricter entry rules in Denmark apply from 14 March at the end of week 11 [3].
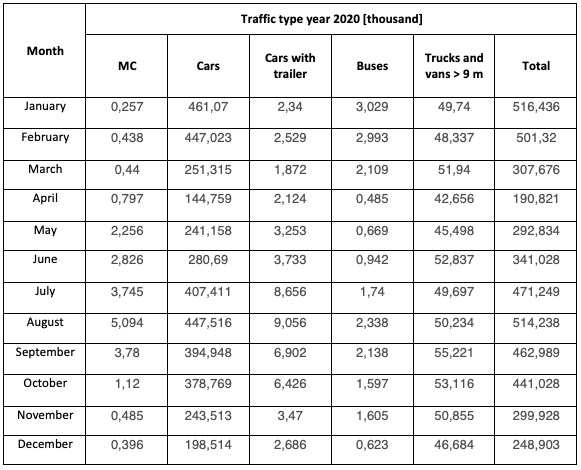
In [3] statistics of number of MC (motor cycles), passenger cars, passenger cars with trailers (this category also includes 6 – 9 m long trucks and vans), buses, trucks over 9 m and the total of all traffic are given. In table 1 statistics per month are presented.
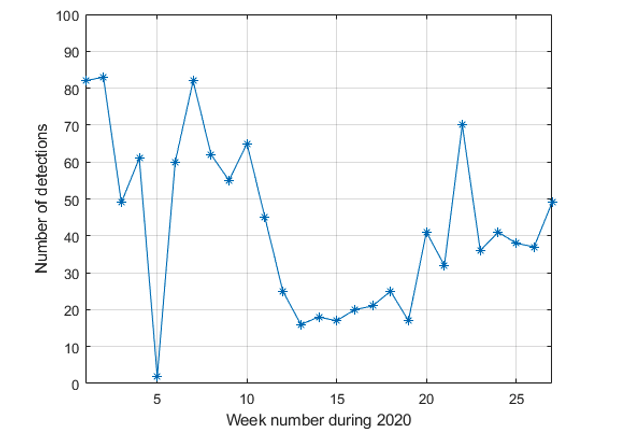
The detection system RF Oculus was placed in the vicinity of the road over the bridge of Öresund between Sweden and Denmark from September 2019 to November 2020. An interesting question to answer is for example, does the traffic passing the bridge during week 1 to 27 in 2020 affect the number of detected interference events during the actual time period? In figure 2 the number of detected interference events are shown. The number of detected events is at most 80 for the selected time span. The results shows that during week 5 only one or two detections occurred. From week 10 to week 13 during 2020 the number of detected events decreased with about 50 events per week.
When comparing with the number of passing vehicles shown in Fig 1 it is evident that there is a strong correlation between the number of passing vehicles and the number of detections, in the weeks between 6 and 25. The drop in detections corresponds very well with the drop in number of passing vehicles at week 11 to 15.
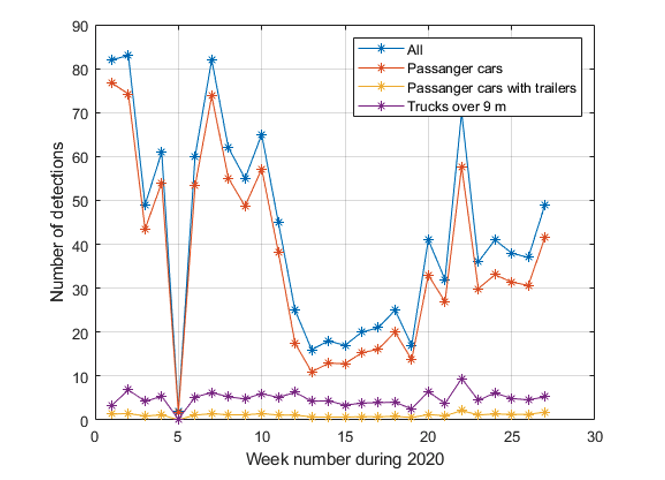
With no information about if any of the traffic types triggers more detections than the other, equal probability for each type can be assumed. For this case the ratio between the traffic types and the total traffic are here used. This ratio is then used to predict the number of detections for each week and the result is shown in figure 3. Results of predicted detections for MC and buses, which becomes lower than one are excluded in the figure. See table 1 for the monthly statistics for each traffic type.
In figure 3, the results for trucks over 9 m, indicate that the number of detection events is estimated to be between 0 and maximum of 10 in week 22. The detections from passenger cars with trailers are at most 2. The estimated number of detections from the traffic type passenger cars clearly causes many more detections per week than other traffic types.
Conclusion
The pandemic lockdown in the spring of 2020 made it possible to determine if the impact from vehicle transports have any significant impact on the interference environment in the civilian GPS frequency band. Measurements were done in the vicinity of the bridge over Öresund, between Sweden and Denmark. A significant reduced level of electromagnetic can be seen as a result of the lockdown in the spring of 2020. Furthermore, these measurement results indicates that personal cars have the largest contribution to the interference in the GPS-band.
Karina Fors, Mikael Alexandersson, Peter Stenumgaard, The Swedish Defence Research Agency (FOI)
References
[1] Roland Bauernfeind, Thomas Kraus, Dominik Dötterböck, Bernd Eissfeller, Erwin Loehnert, and Elmar Wittmann, “Car Jammers: Interference Analysis”, GPS World, October 1, 2011.
[2] Björn Gabrielsson, Karina Fors, Patrik Eliardsson , Mikael Alexandersson and Peter Stenumgaard, “A Portable System for Autonomous Detection and Classification of Electromagnetic Interference in the GPS band”, EMC Europe 2014.
[3] Öresundsbron, “Traffic statistics 2020 – Summary of traffic statistics”, collected 2021-09-01 at website: Self-service | The Oresund Bridge | Traffic Statistics 2021 (oresundsbron.com)