


The ongoing technical development . towards increased densities of co-located electronic systems together with new unintentional interference sources requires analyses of considerable more complex interference environments than before. To handle such environments, dedicated analysis tools and methods are needed to handle larger amounts of electronic systems as well as measurement data from emission measurements. In this paper, some of these challenges are discussed and examples of possible analysis methods are shown.
.
Complex scenarios need new methods
The amount of electronics is constantly increasing in the society, both consumer electronics and in other applications such as automotive, smart industries, smart cities and entertainment. A large variety of applications incorporates wireless technology, in a spectrum from non-demanding social media applications to more demanding critical applications. The wireless part of global Internet traffic is constantly growing and instead of the World Wide Web (WWW) we are therefore now seeing the coming of the World Wide Wireless Web (WWWW). The amount of devices with wireless technology has had a tremendous growth the last years and it is foreseen that the number of devices will grow even further with the development of the next generation of mobile systems, 5G and Massive Internet of Things (IoT), where co-location densities up to 250 000 – 1000000 units per km2 are forecasted. Even more dense scenarios are discussed for future 6G technologies. Here, 100 units per m3 is one example of a possible Key Performance Indicator (KPI) [1]. Instead of “Internet of Things”, the term “Internet of Everything” is used to describe this far-reaching vision for 6G.
Examples of critical wireless applications are in the area of security and safety, machine-to-machine (M2M) communication, automotive applications, autonomous vehicles, banking and financial systems, energy production, transport and logistics. Other specific examples are applications for remote control of trains and communication for landing and take-off of aircrafts. Furthermore, the use of wireless-based sensors is also increasing in the civilian society. Examples are radars for detection of moving objects for collision avoidance, or detection of burglars in buildings.
The increased co-location densities of devices will lead to a need of further development of the overall methodology of achieving EMC. Another emerging development is the growth in renewable energy sources such as wind- and solar power. Recent years, the interference impact on wireless services from solar panels have been highlighted. The combination of denser co-location of wireless systems and the growth of interference produced by e.g. solar panels leads to additional interference risks. Therefore, future analysis tools must be able to handle even this group of interference sources in an efficient way.
The ongoing electrification of the society and especially the development of electrification of personal mobility and goods transport is another challenge. The number of electrical vehicles are going to continue to grow and the vehicles must be charged in an easy and efficient way. Wireless charging of vehicles is hence a tempting solution, but may have a drawback of radiated emissions especially at lower frequencies. Furthermore, the ability of automatic charging of heavy vehicles on electric roads can be a solution for transportation of goods long distances and also for busses in cities. Electric roads makes it possible to travel long distances without stopping for recharging and can reduce the size if the batteries in vehicles. There are several different concepts for electric roads with different EMC properties. One important aspect of electric roads is the radiated emissions and the risk of interfering with communication systems.
To summarize, in order to handle complex interference situations analysis methods must be able to efficiently handle e.g.
- Large number of interfering devices in a scenario,
- Measurement data from emission measurements on electronics,
- Measurement data or maximum allowed interference levels for solar-panel systems,
- Different background levels of man-made noise,
- Different kinds of interference consequences of the total interference,
- Support to identify the dominant interference problem in a complex scenario,
- The possibility to compare the interference impact from different sources,
- Information about the severity level of an identified interference problem,
- Information about the impact on communication range caused by interference.
Furthermore, methods and tools should be designed also for other users than specialized calculation specialists, so that quick analyses can be done on demand when a need arises. An EMC-engineer with basic domain knowledge should be able to make analyses without the need for dedicated specialists on electromagnetic numerical calculations. Emission measurements from a spectrum analyser must be easy to import to the analysis tool for quick analyses. The today used algorithms for calculating communication range and safety distances must be expressed not only with respect to area but also to coverage volume. This is to include even flying and highly located interference sources. An example of how some of these needs could be addressed in a practical analysis tool is given in the next section.
Example of analyses
The research tool GENESIS is developed by FOI for the Swedish Defence Materiel Administration (FMV). Below, GENESIS is used to illustrate some examples of the needs described above for future analysis tools regarding interference impact on wireless services.
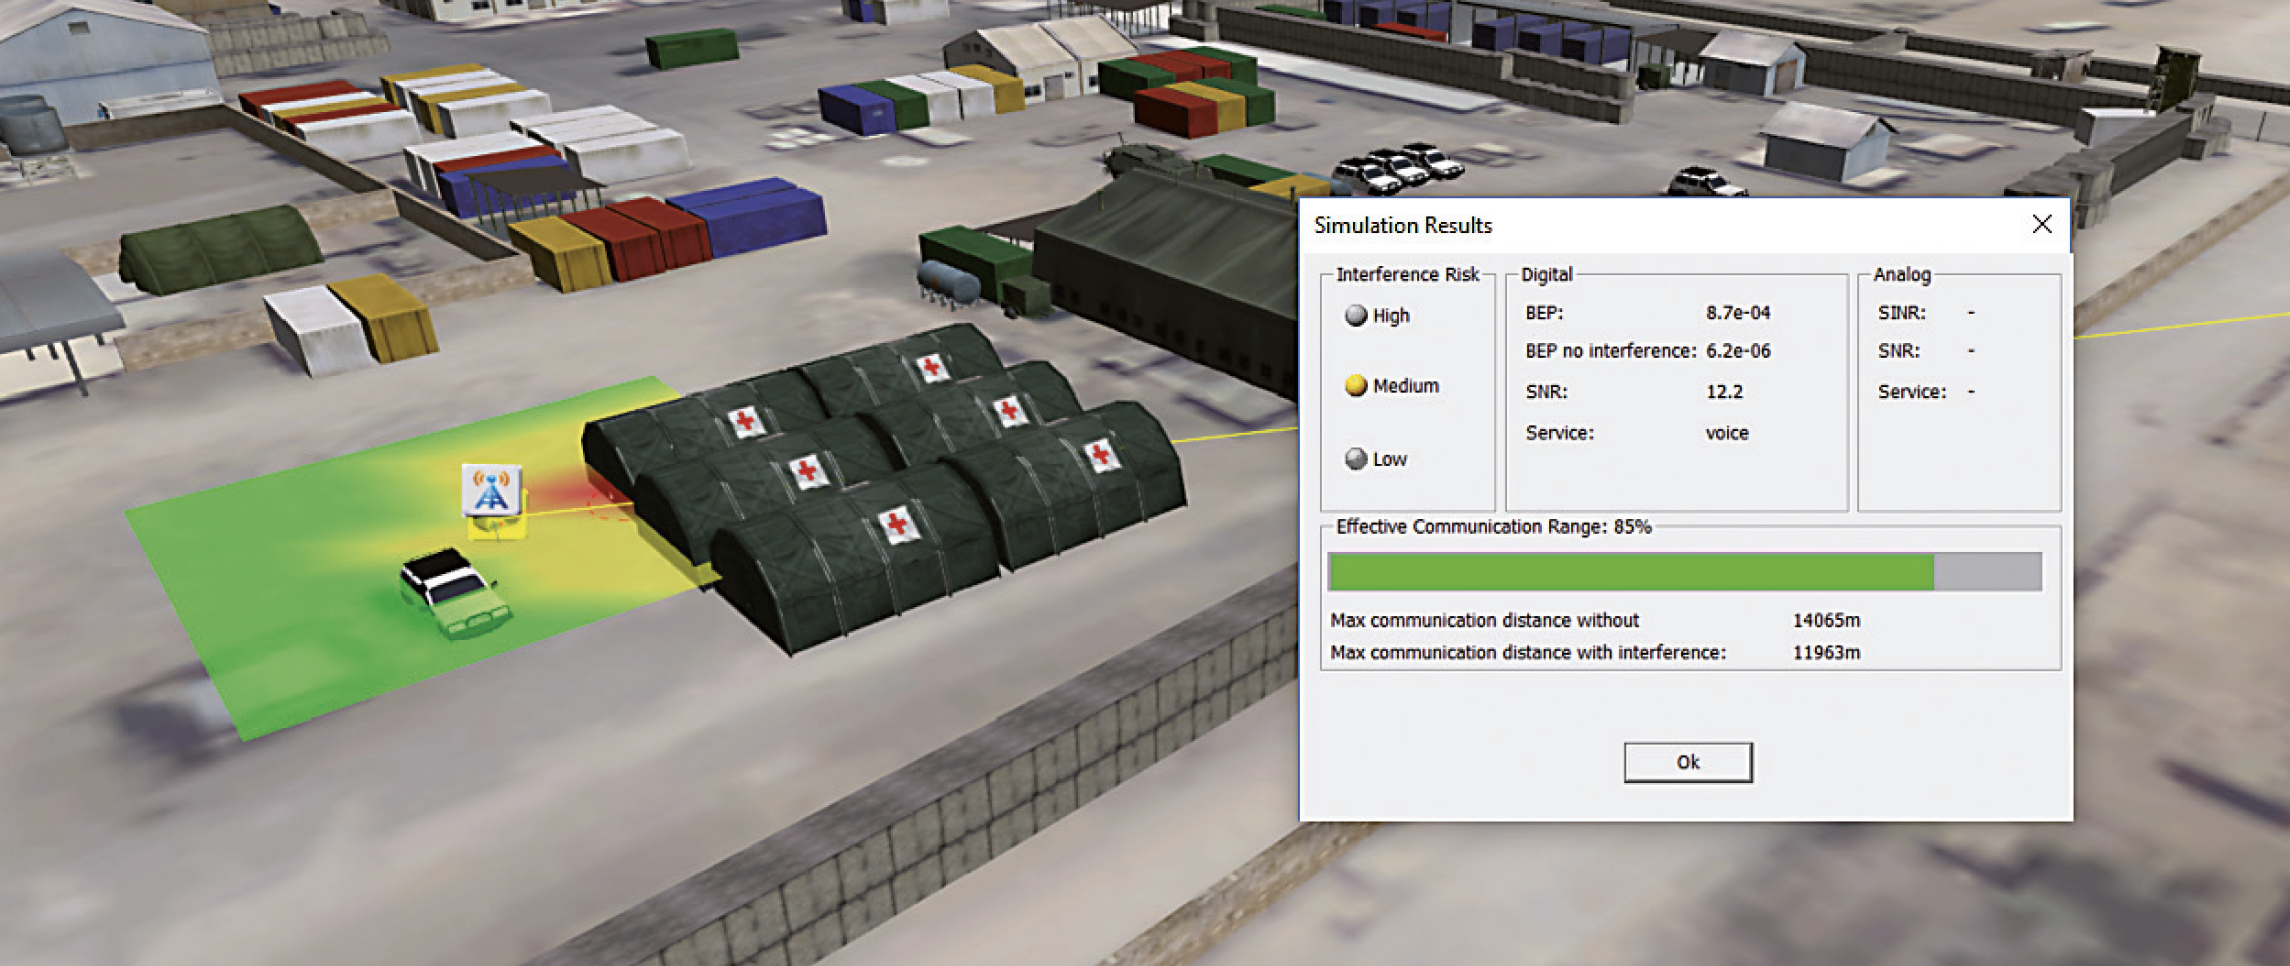
The first example shows a handheld TETRA mobile near a military field hospital, see Fig 1. Similar analyses are performed in [2]. The medical equipment located in the field hospital have measured emission spectra. These spectra are used in the calculations of the possible interference on the communication system. The color-coded area around the communication receiver shows the performance of the communication system. Green indicates sufficient quality, while red indicate that the communication is interrupted/aborted. The bit error probability (BEP) is calculated for the communication link with and without interference (without interference gives the maximum range). The effects from interference on the maximum range of the system is also calculated. In the example, the communication range with interference is 85% of the range without interference.
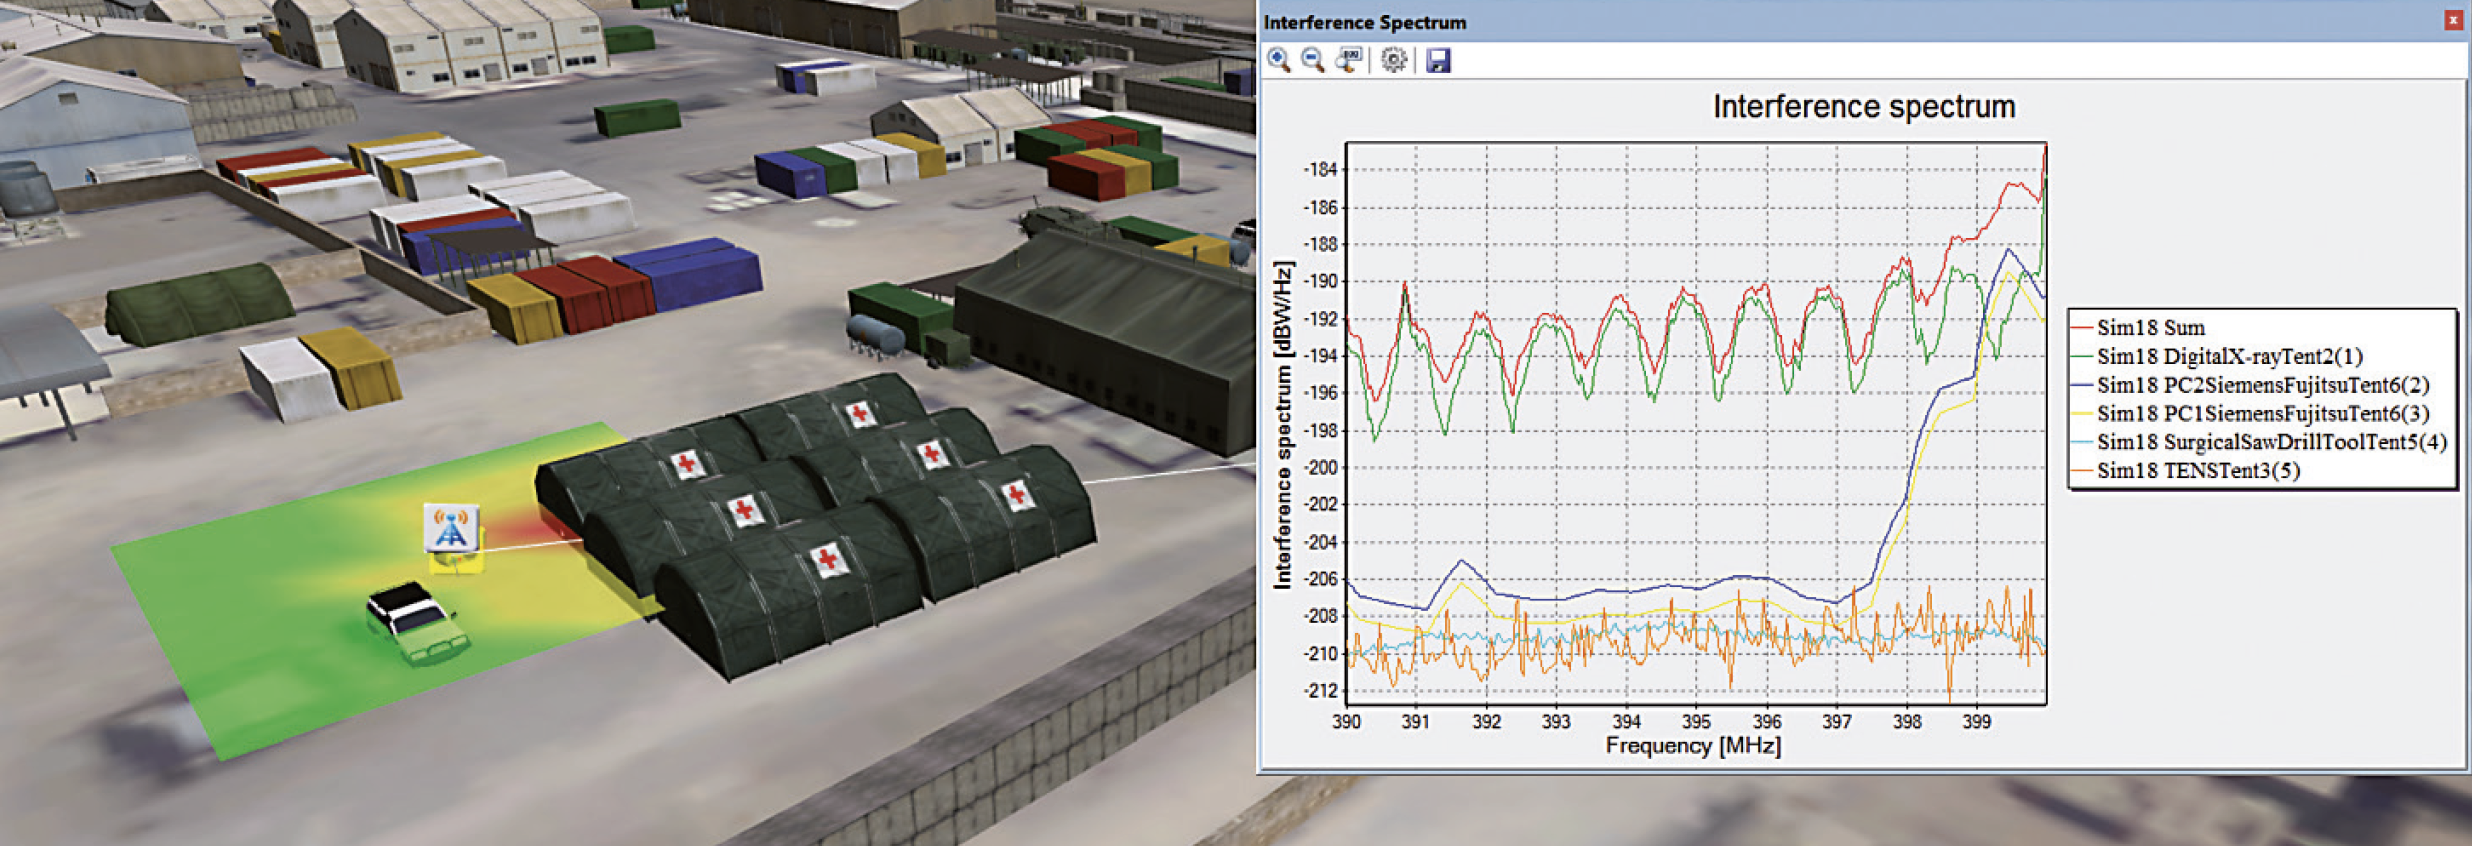
The influence on the receiver is calculated from each equipment that may cause interference individually and for all equipment together. As a results, the equipment that cause most interference in the situation can be determined and indicated to the user, see Fig 2. In the user interface the interference spectra received in the communication system from all equipment can be shown, as well as the received spectra from each equipment separately. In the figure is the sum spectra shown together with the five worst interference sources. Here the communication frequency 395 MHz is used and the worst interferer is a X-ray machine. When the communication system use a different frequency, other equipment can be the source of the highest interference.
Analysis example of solar-panel interference
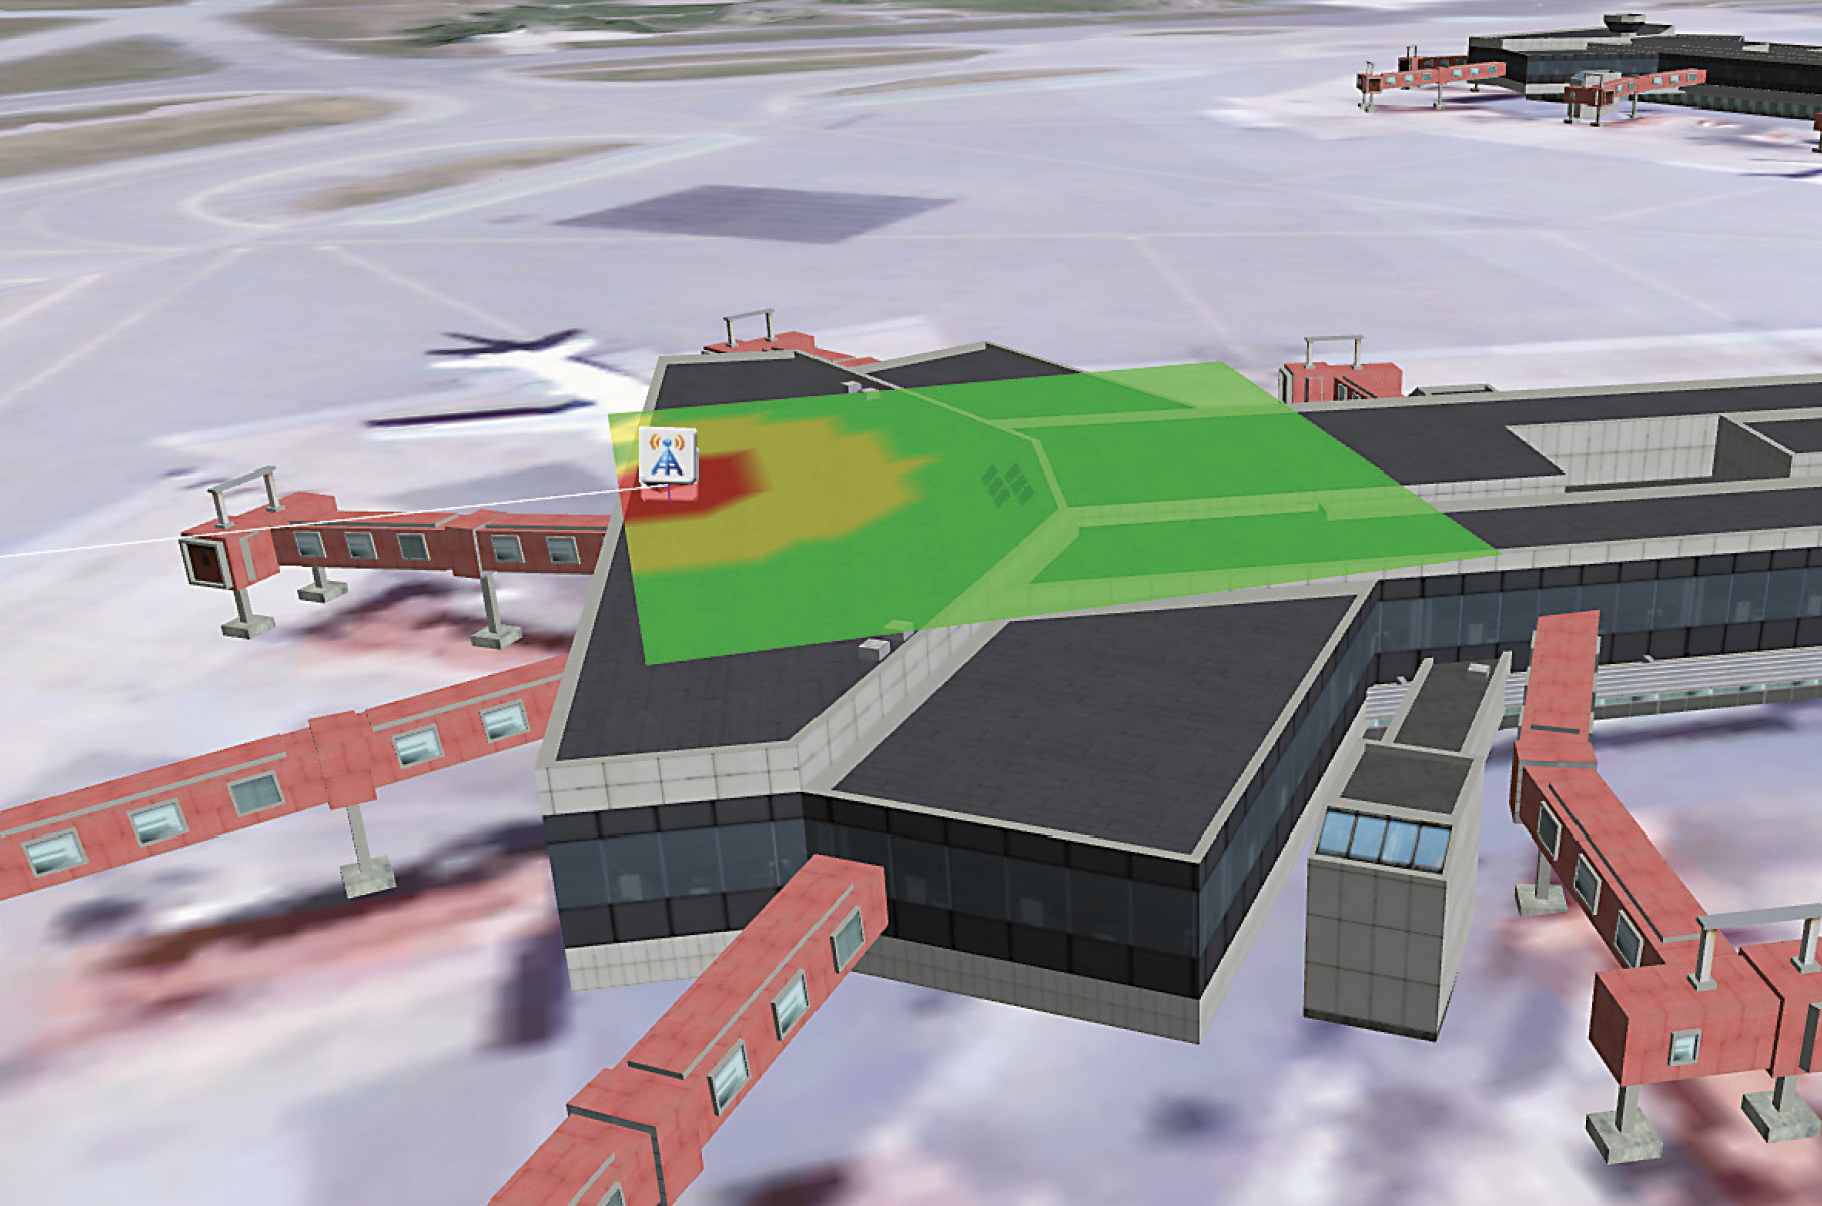
Since the number of solar cell systems is growing and is continuing to do so, it is important to be able to analyze the risk of interference in communication systems nearby. The long cables between the panels on the roof and inverter in the house may act as antennas for signals on the cables. The signals can for example originate from the inverter. In some installations, a substantial amount of electronics is attached to or integrated in the solar panels, such as optimizers or smart panels that include DC/DC-converters. Even if each of the electronic devices fulfil existing emission standards, the sum of the emissions from a large number may add up and interfere with communication systems. In Fig 3, a radio receiver for air-traffic control communications (ATCC) at 118 MHz is co-located with a solar-panel system that radiates according to EN 55022, Class B [3]. The risk area around the receiver is colored with green, yellow and red color, depending on the interference impact on the receiver. In this scenario, the performance of the wireless system will start to decrease at co-location distances in the order of 20 meters if the interference signal is dominated by CW (continuous wave) that equals the level for EN 55022, Class B.
Conclusion
The ongoing technical development towards increased densities of co-located electronic systems as well as new unintentional interference sources gives a need for analyzing considerable more complex interference environments. We have given some examples of such needs and showed how these could be illustrated in tools for analyses of the interference impact on wireless services.
Sara Linder Peter Stenumgaard Swedish Defence Research Agency, FOI
References
[1] “Key Drivers and Research Challenges for 6G Ubiquitous Wireless intelligence”, University of Oulu, September 2019.