


The rapid increase . of wireless systems in safety- and security applications gives a need for automatic monitoring of electromagnetic interference in the vicinity of critical applications. Depending on the actual application of the wireless service, such monitoring might for instance be motivated for safety or security reasons. For efficiency reasons, such automatic monitoring techniques also need to be both cost efficient and relatively easy to use for the operator. The latter requires decision support in terms of methods for automatic analyses and classification of the collected interference data. In this article, the possibility of using Artificial Intelligence for these needs is discussed and exemplified.
The use of wireless technologies is constantly increasing in the society . A large variety of applications incorporates wireless technology, in a spectra from social media applications to more demanding critical applications. Examples of critical applications are in the area of security and safety, machine-to-machine (M2M) communications, automotive applications, banking and financial systems, energy production, transport and logistics. Other specific examples are communication for remote control of trains and for landing and take-off of aircrafts. The amount of wireless devices has had a tremendous growth the last years and it is foreseen that the number of devices will grow even further with the development of the next generation of mobile systems, 5G and massive Internet of Things (IoT).
Wireless communication has several advantages, such as low production cost, high flexibility and low cost for installation. However, all wireless technologies are sensitive to electromagnetic interference and therefore means new challenges from an Electromagnetic Compatibility (EMC) point of view.
The constant increase of wireless and co-located non-wireless electronics in society also means that the total electromagnetic interference environment will continue to increase, both in frequency content and in level. In crowded areas such as cities, factories and airports, the electromagnetic environment tends to be more complex and non-predictable. This development creates an increased need for constantly (24/7) monitoring the electromagnetic interference environment in the vicinity of critical wireless systems. Such monitoring can be needed both for safety and for security reasons, depending on the actual application of the wireless service. Different systems for automatic collection of electromagnetic interference exist today, see e.g. [1][2]. For efficiency reasons, such automatic monitoring techniques need to be both cost efficient and relatively easy to use for the operator. In [1][2] an example of a cost-efficient solution is shown.
However, analysis and classification of measured data is too time consuming to perform manually for continuous measurements 24/7. Therefore, efficient monitoring of the electromagnetic environment requires decision support in terms of efficient algorithms for automatic identification and classification of interference signals in the measured data. A possible solution might be to use methods from the field of Artificial Intelligence (AI). In [3] an example of using a classical algorithm from Machine Learning (ML), for this purpose is shown. ML is a subfield of AI. This example will be reviewed below together with further discussion of possible future development. The paper is organized as follows. In Section II, an example of a system for automatic monitoring of the electromagnetic environment is described. In Section III, a brief description of AI is done and in Section IV, an example of how ML could be used for automatic classification is shown. In Section V, a discussion over future use of AI in EMC applications is done.
Automatic Monitoring of the Electromagnetic Environment
An example of the basic principles of a cost-efficient mesurement system for autonomous monitoring of the electromagnetic environment is presented in [1][2]. The measurement system consists of a software defined radio (SDR), a GPS receiver (u-blox) and an Intel NUC computer (16 Gbyte RAM, Core i5), see Figure 1. The SDR platform in this system is the USRP‑B200mini from Ettus Research together with GNU Radio, which is a free software toolkit for building software-defined radios. The RF signal is down converted and sampled in the USRP, which has the maximum sample rate of 61.44 MS/s at 12 bits resolution. The analog gain, sample rate and instantaneous bandwidth of the USRP are controlled from within the GNU Radio toolkit. After sampling of the RF-signal the digital I/Q representation of the baseband signal is fed to the computer through a USB 3.0 interface.
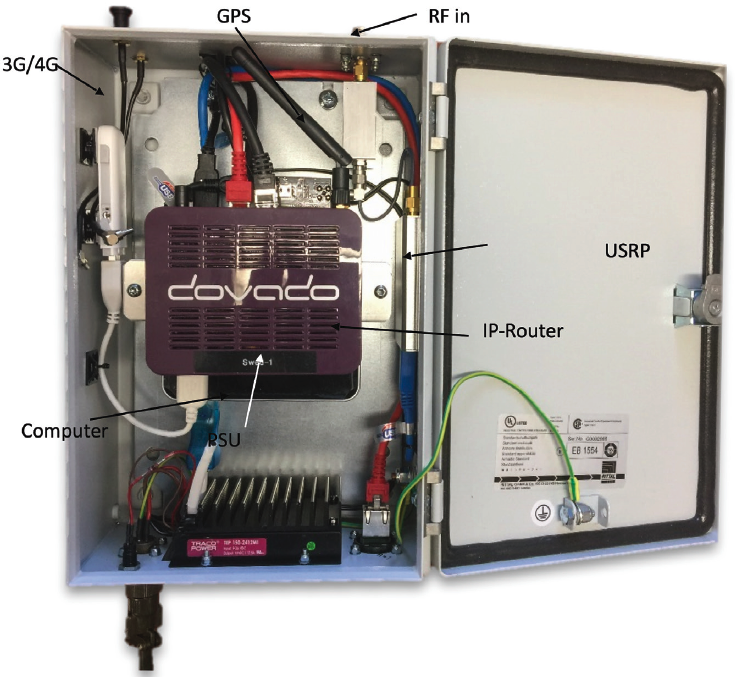
Different types of detector algorithms are implemented within the GNU Radio toolkit to detect and characterize different types of electromagnetic interference. If a possible interference event is detected a spectrum is generated and the I/Q representation of the signal is automatically saved for deeper offline analysis. The status of the GPS receiver is continually monitored so that possible incidents can be correlated to the GPS receiver status.
The measurement system runs automatically. It is possible to remotely control and update the system through a secure remote connection over the Internet. The system can be connected to the Internet with either an Ethernet cable or a wireless 3G/4G modem. Measurement data can also be downloaded through this connection.
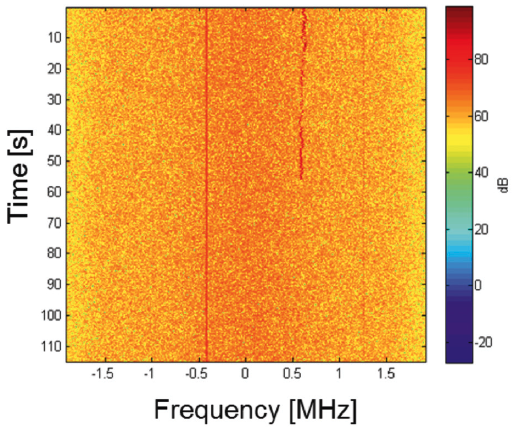
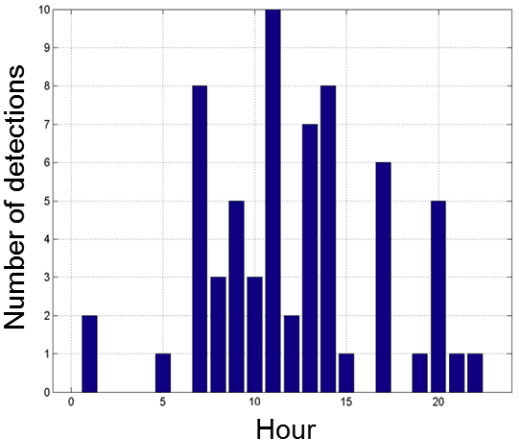
The measurement results can be visualized in different ways, depending on the purpose of the analysis. Examples are shown in Figure 2 och 3. In Figure 2, a waterfall spectrogram is shown of an interference event that appears for about 55 seconds and then dissapears. In Figure 3, the number of registered interference events over time is shown. Since the number of events vary over the day, this information could be useful for troubleshooting to find the reason for an unintentional electromagnetic interference.
Artificial Intelligence
Artificial Intelligence is a way of making a computer, a computer-controlled robot, or a software think intelligently, in the similar manner that humans think. AI is accomplished by studying how human brains think and how humans learn, decide, and work while trying to solve a problem, and then using the outcomes of this study as a basis of developing intelligent software and systems.
Machine Learning (ML) is a subfield of AI. The goal of ML generally is to understand the structure of data and fit that data into models that can utilized. In ML we will give the system a set of inputs and outputs that is associated and the system will generate the code for matching these inputs to outputs. Once that has been done, we can use the system to produce output from another set of input. Thus, ML models learn from the past, and they implicitly assume that the future is going to behave similarly. There are three basic kinds of ML Algorithms:
a. Supervised Learning
b. Unsupervised Learning
c. Reinforcement Learning.
Supervised learning infers a function from labelled training data consisting of a set of training examples. A supervised learning algorithm analyzes the training data and produces an inferred function, which can be used for mapping new examples, of unseen instances. Mathematically, supervised learning is where we have both input variables (A) and the corresponding desired output variables (B). We use an algorithm to derive the mapping function from the input to the desired output. A typical example is visual recognition where the algorithm is trained to identify moving pedestrians in fast changing scenes recorded by video cameras.
Mathematically, unsupervised learning is when you only have input data (A) and no corresponding output variables, i.e. data has not been classified or categorized. Since the data is not classified, there is no straightforward way to evaluate the accuracy of the structure that is produced by the algorithm. Regression models are used when the response variable (i.e. the variable that is predicted) is continuous. For example, bit-error rate for a digital communication link is continuous. That is, it can be placed and ordered on a number line as a function of e.g. the signal-to-noise ratio (SNR).
In reinforcement learning, a computer program will interact with a dynamic environment in which it must perform a particular goal. The program is provided feedback in terms of rewards and punishments as it navigates its problem space. However, the algorithm does not have explicit knowledge of whether it has come close to its goal. Instead, the algorithm takes actions in an environment in order to maximize the cumulative reward. For example, in the field of cognitive radio, it is possible to model the dynamic transition of spectrum availability as a Markov chain, and extensively apply reinforcement learning methods to make the decision whether or not it is suitable for secondary transmission in one primary licensed spectrum.
A special branch of machine learning that has become popular recent years is Deep Learning. Deep learning is a subset of machine learning where artificial neural networks, algorithms inspired by the human brain, learn from large amounts of data. Deep learning allows machines to solve complex problems even when using a data set that is very diverse, unstructured and inter-connected.
Example: ML for Classification of Interference
The k-Nearest Neighbor algorithm is a very intuitive ML method that classifies unlabeled examples based on their similarity to examples in a training set. That is, for a given unlabeled example xu, find the k “closest” labeled examples in the training data set and assign xu to the class that appears most frequently within the k-subset (e.g. a majority decision).
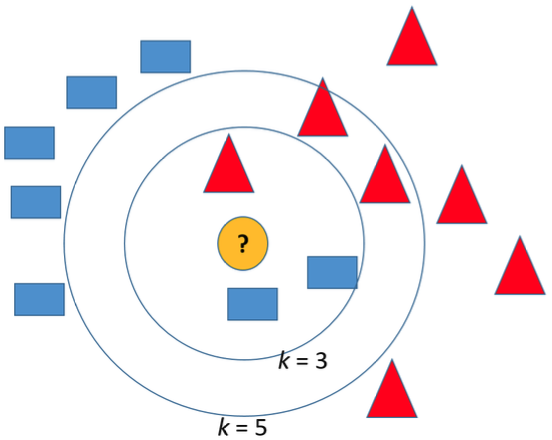
The k-NN algorithm is a robust and versatile classifier that is often used as a benchmark for more complex classifiers such as Artificial Neural Networks (ANN) and Support Vector Machines (SVM). k-NN belongs to the supervised learning family of algorithms. The k-NN algorithm forms a majority vote between the k most similar instances to a given observation, see Figure 4.
As an example, the k-NN algorithm is used for classification of measured interference in the frequency band for air-traffic control communications (ATCC). In ATCC, amplitude modulation (AM) is used. If we would like to monitor the electromagnetic environment in a frequency band used for ATCC, we will have a mix of AM signals and other unintentional electromagnetic interference. Our problem is therefore to automatically classify the dominant waveform measured into classes labeled “AM” and several classes of possible interference waveforms. In our case, four basic interference waveforms are used:
- Wideband Noise, represented by Additive White Gaussian Noise (AWGN),
- Continuous wave (CW),
- Middleton Class A noise (ClassA)[4],
- Frequency Modulation (FM).
The Middleton Class A model has the advantage that it can be made arbitrary impulsive or close to a Gaussian distribution, depending on the parameter settings for the model. The use of this model for our case is further explained in [3]. In order to train the ML-algorithm, some statistical features calculated on the measured data must be chosen. In this case, we have chosen the following statistical features:
- Spectrum symmetry around the carrier frequency of the measured signal,
- Impulsiveness Ratio (IR),
- The variance of the absolute value of the measured signal level. This makes it possible to differ between a constant and non-constant envelope.
Spectrum symmetry is in this case measured by comparison of the amount of signal power over and below the carrier frequency [3].
The impulsiveness ratio (IR) is a parameter that is often used to characterize the impulsiveness of a signal and is defined as

where Vrms and Vaverage denote the root-mean-square (rms) and the average value of the signal in linear scale.
The algorithm is trained by feeding it with the different interference waveforms. After training, the performance of the algorithm is tested by a so called confusion matrix, where the input data (with the true classes) is shown on the vetical axis and the predicted classes are shown on the horizontal axis, see Figure 5.
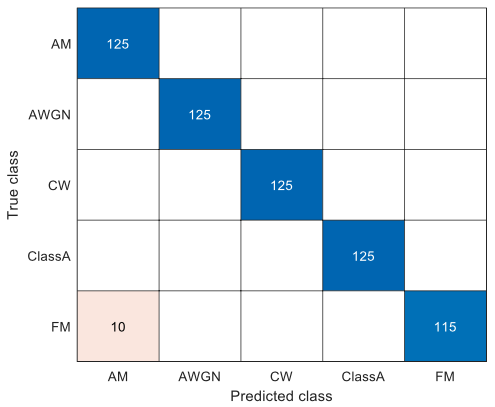
In Figure 5 it is seen that the classification is done correctly for all interference waveforms except for 10 of 125 FM signals. The reason in this case is that the spectrum symmetry feature is sensitive for error in the estimation of the carrier frequency. An error in the estimation of carrier frequency will introduce errors to the spectrum symmetry feature, which can cause the classifier to choose AM instead of FM. However, such drawback could be adjusted for in the algorithmby a better estimation of the carrier frequency. Furthermore, the signal-to-interference ratio (SNR) in Figure 5 is only 10 dB, which is on the absolute minimum to achieve good communication quality for the operator. This means that the classifier operates in quite harsh conditions. An increase in SNR will probably reduce the small misclassification between FM and AM. The overall conclusion is that a k-NN classifier is a promising alternative for automatic classification of unintentional electromagnetic interference in a monitored frequency band for radio communication.
Possible Future use of AI in EMC Applications
The need for automatic 24/7 monitoring of unintentional electromagnetic interference in the vicinity of critical wireless applications, requires cost-efficient measurement system as well as decision support for automatic classification of the different kinds of interference signals. We have shown how machine learning could be used for this purpose. The results are an example of the potential of using AI methods in EMC applications. In all EMC-related applications where some kind of classification of interference is needed, AI methods might have the potential to meet this need. There are also other potential applications of AI within EMC. One application might be in the field of cognitive radio in the context of dynamic spectrum management. Here, reinforcement learning methods might be possible to use to make the decision whether or not a frequency is suitable for secondary transmission in one primary licensed spectrum. The quality parameter could be in terms of least interference to the primary spectrum. Thus, classification problems and spectrum management with real-time requirements are two interesting areas to further investigate for future use of AI within EMC.
Patrik Eliardsson, Peter Stenumgaard, Mikael Alexandersson Swedish Defence Research Agency (FOI)
References
[1] B. Gabrielsson, K. Fors, P. Eliardsson, M. Alexandersson and P. Stenumgaard, ”A portable system for autonomous detection and classification of electromagnetic interference in the GPS band,” 2014 International Symposium on Electromagnetic Compatibility, Gothenburg, 2014, pp. 152-157.
[2] K. Fors, K. Wiklundh, P. Eliardsson and M. Alexandersson, ”A detection method for interference measurements in partly occupied radio frequency bands,” 2017 International Symposium on Electromagnetic Compatibility – EMC EUROPE, Angers, 2017, pp. 1-6.
[3] P Eliardsson, P Stenumgaard, “Artificial Intelligence for Automatic Classification of Unintentional Electromagnetic Interference in Air Traffic Control Communications“, proceedings of EMC Europe 2019, International Symposium on Electromagnetic Compatibility, Barcelona, Spain.
[4] D. Middleton, “Statistical-physical models of electromagnetic interference,” IEEE Trans. Electromagn. Compat., vol. 19, no. 3, pp.106-127, Aug. 1977.