

An article in Electronic Environment . 2017/2, is about the fundamental failure mechanisms (capacitive, inductive coupling and frame voltage) that cause EDM (Electric Discharge Machining aka Bearing Currents or Electric Erosion) in bearings. This article expands on the theme and shows why “The Simple Explanation”, The Mathematical Models and the Real World view on EDM differ, both in nature and in practical use. It also adds a couple of new insights that are becoming more and more valid with the widespread use of Frequency Inverters and loads with higher-than-normal capacitance to ground.
.
The simple explanation
The simple explanation plus the common failure modes are discussed on p. 28 through 31 (in the 2017/2 article) while typical waveforms and measurements are shown on p. 32-34. Case studies, mitigation methods and the resulting measurement protocols are on pages 34-37.
New findings
We have seen, already around ten years ago, that there’s more to EDM than the three failure mechanisms say but were not so sure what actually happened in those cases. But, as more and more of those cases hit more and more installation, that has changed. The findings are not sensational, but something that one needs to understand in order to fight EDM successfully:
- A VFD with the correct V/f ratio and motor wrongly connected (Wye instead of Delta is an example) or simply an incorrect (too low) voltage set in the VFD causes increased slip, which heats the rotor, shaft and bearing. With bearing damages as a consequence. RTD or other thermal protection is invariably in the stator winding and does not readily detect the hot rotor.
- The rule-of-thumb that discharge voltages below 5 V causes no harm does not always apply. We have seen severe EDM already at 3 V. In those cases, there were large rotating loads (large diameter fans, or centrifuges with multiple rotating cones or several machines on same shaft etcetera) directly coupled to the motor shaft. The increased capacitive load leads to more energy in the discharge – which makes the damage larger.
We have also met a deeply rooted opinion that all the problems can be avoided if you only run a simulation in Multiphysics or Mathematica or a home-brew model of the motor. And, if the model says that there are no problems, there will not be any problems.
The mathematical models
That could be a very commendable way to predict and avoid the risk of bearing currents and EDM in an installation. But there are a few problems, the difficulties associated with obtaining all the needed parameters that are needed for such a simulation. The models are usually built on assumed or measured properties of the motors themselves, the cabling, the bearings, the oil films and the drive systems. The “better” the model, the less generalized the results are and that has brought out a plethora of simulations of 2.2 or 11 kW four-pole machines fed from a VFD with certain properties using a cable being “of suitable length” etcetera, etcetera. The results may be interesting to academia but, not surprising, difficult to use IRL and not very useful for the practicing engineer.
The IEEE model
Is fairly accurate but needs even more data to be successfully used. Those data are not readily available and need to be collected from drive, motor, cable, bearing and sometimes grease manufacturers. Which mostly have no idea what it is about and feed you some arbitrary – sometimes quite plausible – parameters that result in some kind of output that may or may not be useful.
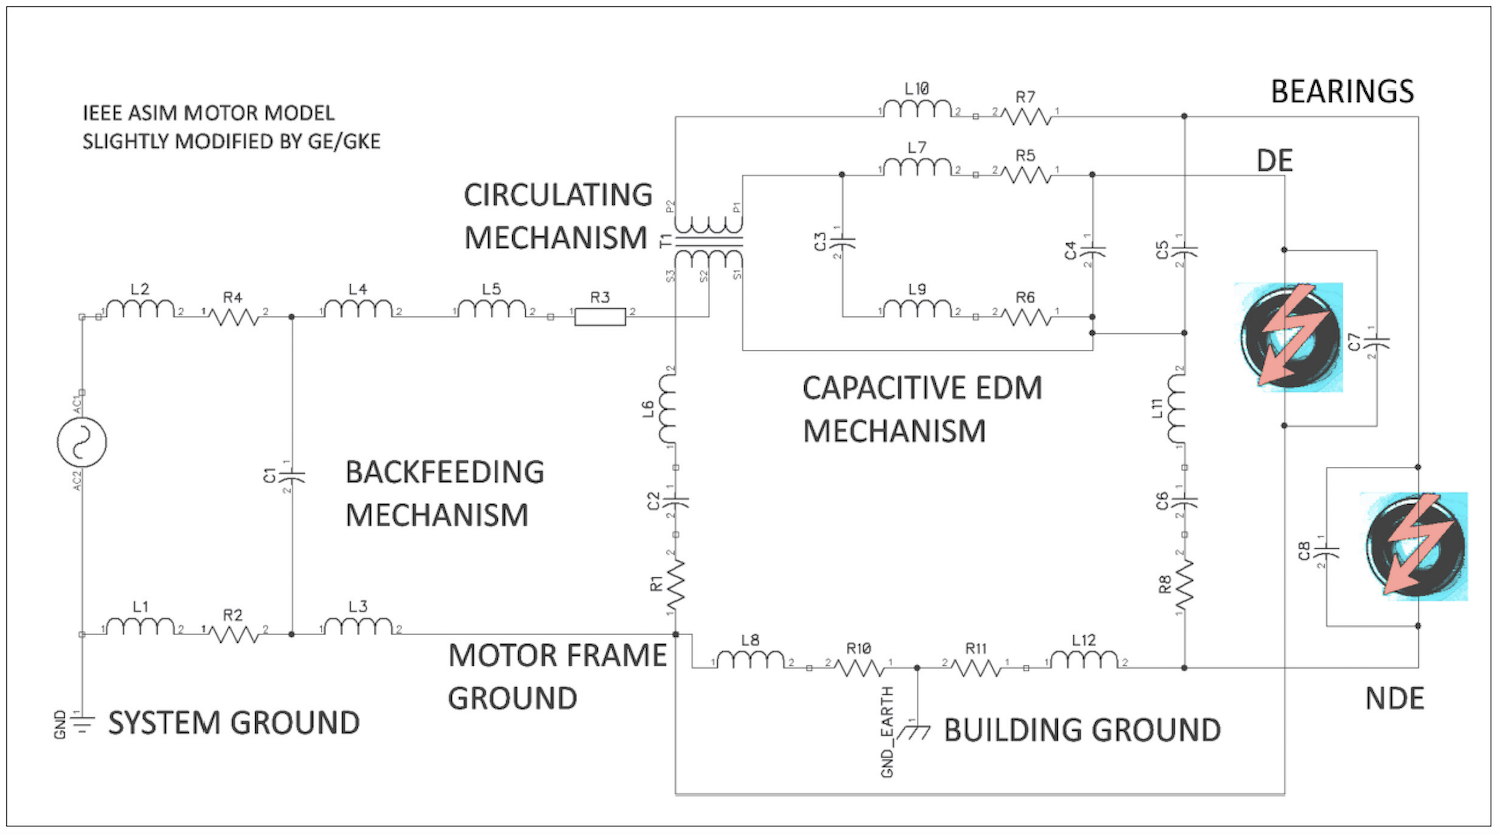
As can be seen from the IEEE model, the motor model itself needs an immense number of data. Data that are definitely not in the motor catalogues, which at best list stator and rotor resistance, inductance and leakage inductance. Sometimes capacitance from winding to frame. All other parameters, at least ten of them, are usually not known even by the personnel in the motor manufacturer’s design departments or labs. And then, you still need oil/grease data at a range of temperatures. So, again, modelling a complete VFD/cable/motor installation is a nice and interesting activity if you have the time – and if all parameters are available to the needed degree of accuracy. Status today: Not possible, but AI may change that. If a simulation plus interpretation can be done in one day, week, month – or at all is difficult to say. So, we don’t spend much time on that. None, to be true.
Real World – What experience reveals
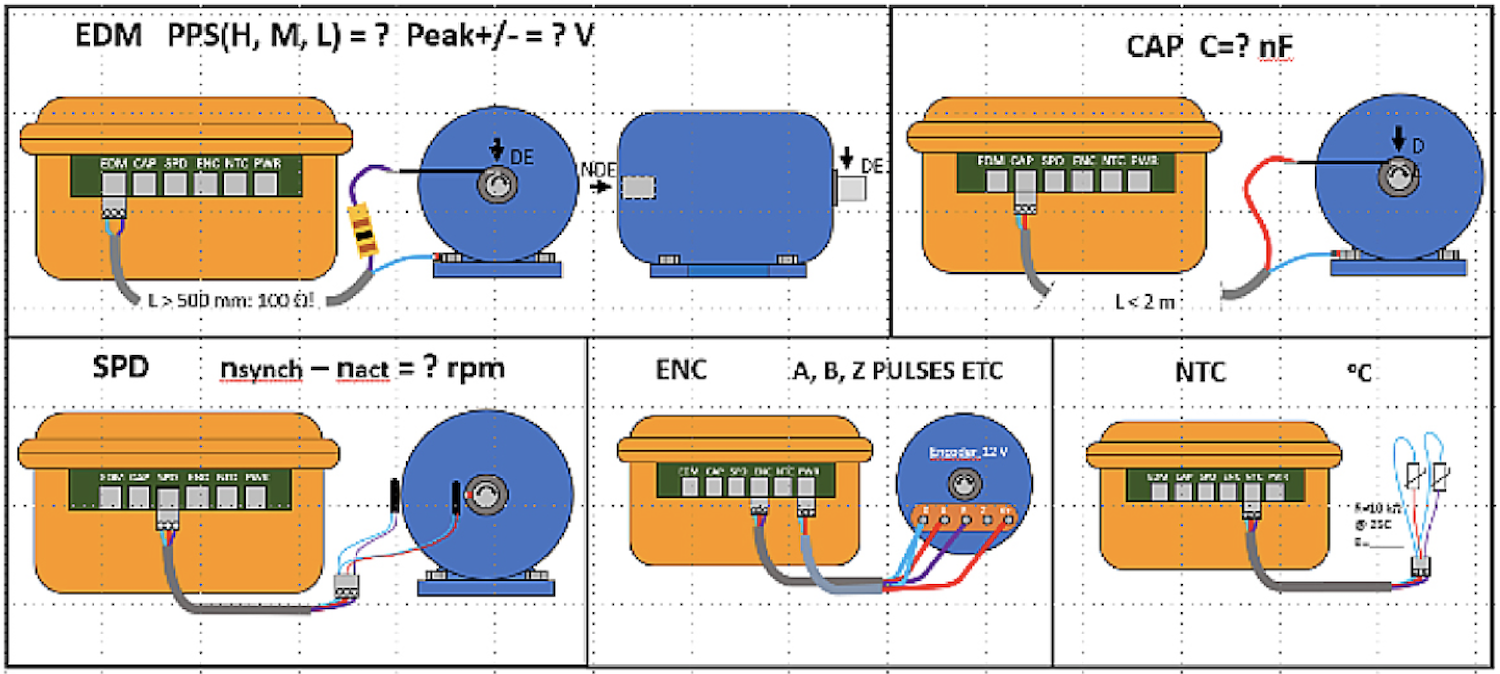
More than twenty years of field work, seminars, lab measurements and consultation for large drive and motor manufacturers has given us the opportunity to see through and beyond both the simple explanations and the complex models. Of the hundreds of cases, that we have solved, there are distinct groups of problems with common dominating problems. There are also minor contributing problems that obscures the view and sometimes make a clear-cut case look like a mysterious exception that makes sorcery and witchcraft came to mind. To re-iterate on the “New findings” mentioned before we decided to include a host of specially tailored measurement functions that can measure and include the following data in the protocol:
- High total rotor and attached load capacitance. In such a case, there can be severe EDM in the bearings even if the indicated number of PPS or the peak voltages are well under any critical values. The reason for this is that discharge energy in the bearings is proportional to bearing voltage squared and total capacitance. It is necessary to know the capacitance of the complete rotating system to be able to understand what is going on in the system. That kind of measurement is difficult to carry out since the motor needs to be running and that means that there are lots of interfering signals that makes capacitance measurements next to impossible. One has to use selective measurements that uses the calm period between inverter switching. Those periods mostly range from tens of μs to a few hundred μs and it is necessary to resort to statistical methods and variable threshold references to get a reliable measurement.
- High rotor slip, usually caused by incorrect U/f ratio. The high slip causes high rotor and shaft temperature that heats the bearing. That makes the oil film thinner, sometimes so thin that there is a metal-metal contact between balls and raceways. Having that means that there is no voltage across the bearing, nothing can be measured with scope or Beppe but the EDM is indisputably there with dull balls and fluted raceways. That is why a slip measurement method is a valuable addition to the analysis tool-box. Slip is measured either as the difference between stator stray flux, which corresponds to synchronous speed, and shaft speed. The latter can be measured with a simple, debounced, reed switch plus a small magnet attached to the motor shaft. Sometimes it is better to use an existing rotary encoder. So that possibility is included as well.
- High bearing temperature can have many other causes. Bad cooling, high ambient temperature and a few other reasons exist. Measuring the bearing temperature should be included in a complete investigation and the results added to the other data captured.
Additional functionality
Having the hardware for these basic measurements, it would be unwise not to extend the software to include measurement of speed differences (important between groups in a paper machine etcetera) and a complete mapping of pulses from an encoder. Such measurements are implemented and makes the tool universally useful for variable speed verification or problem solving.
“The last say”
Regardless of what measurements you do, the most important measurements are in the EDM group. They reveal actual EDM events and, as already mentioned, “Reality always has the last say”, such measurements take precedence over the most elaborate simulations. Even if the models are 100% correct and all parameters have been obtained. If the model is accurate enough, it and actual measurements on the motor will give identical results. Measurements on the motor seldom take longer than 10 or 20 minutes (if there are protective covers to remove, you need to add several hours to that ) – compare that to model building, parameter hunting, verifying and running a simulation. A task that easily consumes days and weeks. Admitted, model building is more fun even if you can’t use the result for other purposes than publishing an article in a paper – or as part of an exam in engineering.
But IRL, you can’t do that. Checking the EDM status is like vibration monitoring – it needs to be done in short time. Simply because an installation may comprise hundreds of motors – a typical mall can easily have a couple of hundreds of them. So, measurement is a must. It can be done at a rate of five to ten motors/hour and even if it will take a few days to check 200 motors, it is not such a formidable task.
Protocol
You know the situation: Balancing on a ladder (if you are lucky) close to a motor making measurements with two hands, holding yourself with a third hand and taking notes with the fourth and fifth hand. Then back to office to write a report only to find out that you have a lot of data but no clear idea from where or under what conditions they were taken because the notes were incomplete, dropped or illegible. Multiply that by 200 or 500 and the value of an automated report generator is obvious. If the report generator includes ALL data (EDM, Capacitance, Temperatures, Slip or speed plus pictures of motor labels and name-plates, bearing noise and spoken or written comments) one would tend to fall in love with it.
Using a smartphone as the user interface makes that possible. Control the measurements (automatic sequence) from a safe level, place, free from dust and steam and transfer all measurements over WiFi/BLE to PC, printer or other phone. All that is now a simple matter, enabled by the use of a smartphone. We are sorry that we didn’t start that development earlier on – but happy that we finally did!
Gunnar Englund GKE Elektronik