


Introduction . The European Union (EU) Horizon2020 project Standardisation of Global Navigation Satellite System (GNSS) Threat Reporting and Receiver Testing through International Knowledge Exchange, Experimentation and Exploitation (STRIKE3) is a new European initiative to support the increasing use of GNSS within safety, security, governmental and regulated applications. One of the objectives of STRIKE3 is the deployment and operation of an international GNSS interference monitoring network to capture the scale and dynamics of the problem, and to work with international GNSS partners to develop, negotiate, promote and implement standards for threat reporting and receiver testing. Both standards are missing across all civil application domains and are considered a barrier to the wider adoption and success of GNSS in the higher value markets.
The STRIKE3 Consortium brings together competences from GNSS research and development technology, GNSS within transportation, GNSS testing, and GNSS interference. The partners include Nottingham Scientific Limited (UK), the Swedish Defence Research Agency (Sweden), the Finnish Geospatial Research Institute of the National Land Survey (Finland), the Automotive and Rail Innovation Center (Germany), GNSS Labs (India), and the Electronics and Telecommunications Research Institute (South Korea). The project duration is 36 months (February 2016 to February 2019).
The problem of radio frequency interference in the GNSS frequency bands affects diverse applications, from the more traditional such as truck tolling, determining road tax, maritime vessel monitoring, and offender tracking, to the more recent such as automated vehicle navigation, integrity-intensive airplane landing procedures, and Pokemon Go! Likely causes of threats to GNSS include unintentional threats, intentional (incidental and/or malicious) threats, and threats due to natural disturbances. To understand the level of threats, and to develop effective countermeasures, it is highly desirable to monitor for interference in a systematic way and to share the results with interested stakeholders.
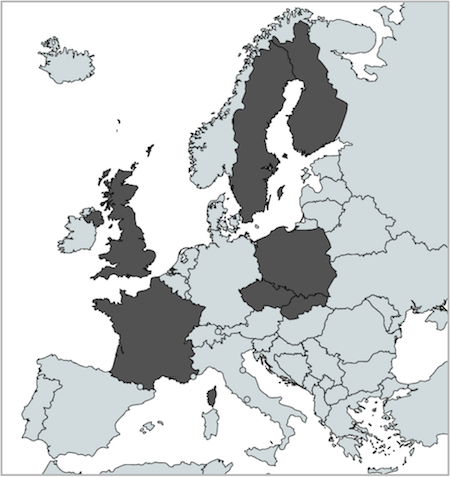
This article presents measurement results from a survey of the existence of GPS interference and jammers within Europe. The measurement started in the late March 2016 and ended in the beginning of July 2016. Interference detection equipment were deployed ‘as is’ in seven European countries; Sweden, UK, France, Czech Republic, Poland, Slovakia and Finland, see fig. 1. In total eleven different site locations are covered among these countries.
Measurement campaign
Two different monitoring systems are brought to the STRIKE3 project by the consortium for use in the international threat collection activity. Having different types of equipment is important for STRIKE3 where the aim is to develop reporting standards that are not tied to a particular product and can be supported by multiple interference monitoring systems. The two types of monitoring system used in the international threat collection activity are described in the following sections. It is important to note that they are deployed ‘as is’ with no specific modification to the hardware, software (SW) or message formats for STRIKE3. The analysis of the results and conclusions from this activity will help feed into the standards development activity.
RF Oculus
RF-Oculus is mainly a research platform based on low cost commercial-off-the-shelf (COTS) components, see Fig. 2. The measurement system consists of a software defined radio (SDR), a GNSS receiver and an Intel NUC computer. The SDR front-end samples the civilian L1 GNSS continuously with an instantaneous bandwidth of 4 MHz. The complex baseband signal is used for interference detection and classification. An energy detector is used to detect interference events and an Impulsiveness Ratio (IR) detector is used to classify the interference.
A database in each node stores the GPS C/N0, received power from the SDR front-end, Impulsiveness Ratio (IR) value and current position. In case of an interference event start time, stop time and a frequency spectrum of the event is stored to the database. The corresponding baseband signal for the interference event is also stored at the nodes hard disk.
The RF Oculus can run standalone at a site or several nodes from one or different sites can be connected to a central server. The central server runs a web-server which lets the end users to browse the detected events. The web application at the central server displays detection statistics, detailed information such as power graph, duration of each interference event etc.
Detector V1
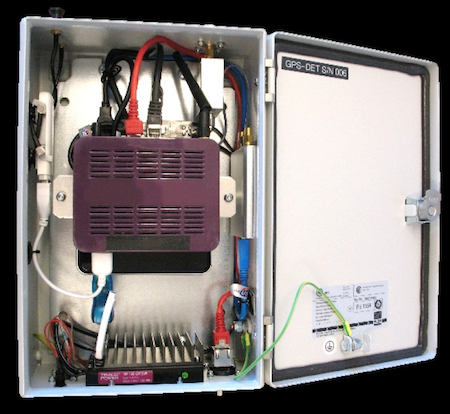
DETECTOR is a commercially available system for GNSS interference monitoring and characterization. The prototype system was originally developed in the DETECTOR project (funded by the GSA under the FP7 programme), which was led by NSL.
The field probe is a 19” rack mounted unit that contains a software defined radio (SDR), a COTS GNSS receiver and a computer see Fig. 3. The SDR front-end samples the civilian L1 GNSS continuously. Both pre- and post-correlation techniques are used to check for interference. Once interference is detected, this triggers an event and the power readings and GNSS Rx tracking information are logged for the duration of the event, as well as the start and end time and a digital sample of the raw data. Once the interference is no longer detected, the event is closed and the event message is sent to the remote back-office.
The DETECTOR V1 back-office is a remote facility that receives, processes and stores events from multiple field probes. SW at the back-office processes the data sample to generate spectrum and spectrogram plots, and to perform classification of the signal type. The information about each event is stored in a database and analysis tools are available to provide statistics about events. Events are categorized as follows: Priority Level, Device, Classification type, Power, Duration of event and Event Type.
Measurement results
This section presents an overview of the results from all the monitoring locations. The purpose of this section is to study the level of interference (i.e. number of detections) at the different sites in order to identify those that are most active, and to see if there is any link between the type of site and the level of activity.
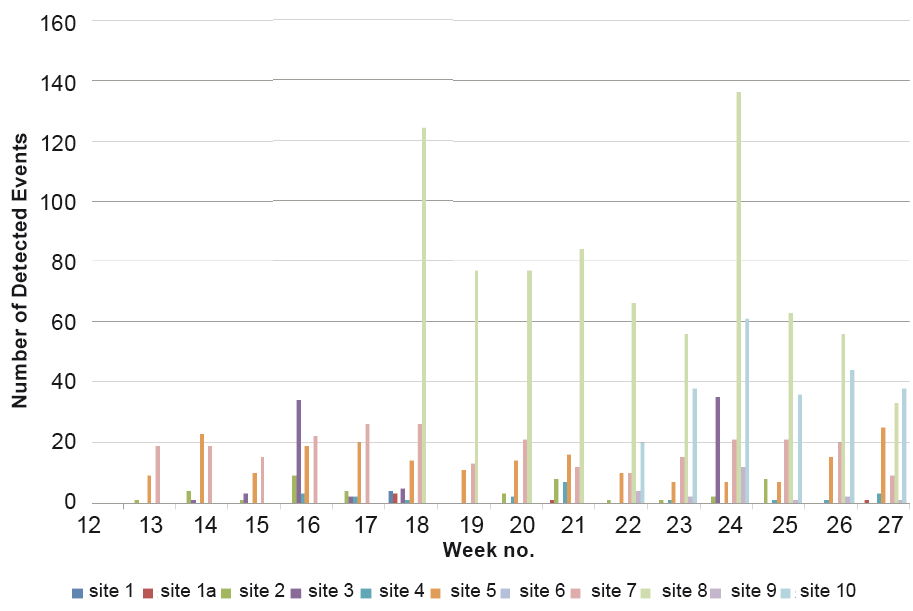
For assessing the overall level of interference, weekly numbers of detected interference events at each site are displayed in Fig. 4. The results run from week 12 (21st March) 2016 through to week 27 (4th July) 2016. It should be noted that the sites were active at different times through this period so not all weeks – particularly those at the beginning – have results from all sites.
It is clear from the results that there is a huge variation in the number of events detected at each site, with some sites (e.g. site 8) registering hundreds of events per week and others (e.g. site 1) detecting less than 10 per week. There is also significant variation in the weekly numbers at some sites, showing that the interference at a site is not identical from week to week. An example of this is site 5, which in most weeks has up to 50 events but some weeks has several hundred events detected. Site 5 is located at an electricity substation in an urban area.
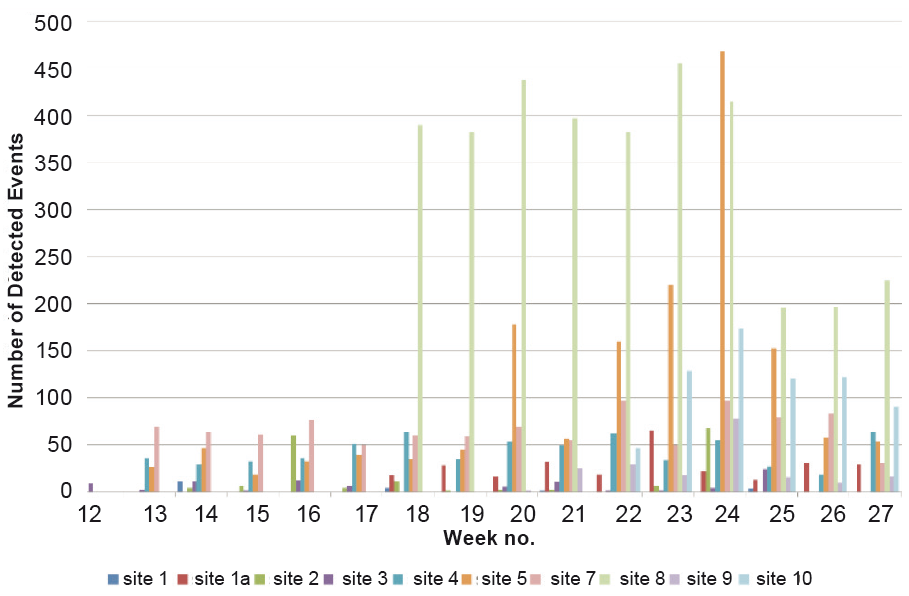
The sites with most detected interference in a weekly perspective are site 8 and site 10, despite site 5. Site 8 is located at an office building in a busy city area, whilst site 10 is in the vicinity of a major road.
Of course, not all detected interference events are significant and may just be low level ‘noise’ caused by equipment at the site. Therefore the weekly number of ‘significant’ events is also plotted for each site. In this sense, significant events are those that last for more than 1 second (RF Oculus system) or are flagged as ‘high’ priority (Detector system).
When considering just significant interference events, the numbers are much lower than when all events are considered, see Fig. 5. Nevertheless, there are still some sites (e.g. site 8) that can have over 100 significant events detected per week. The difference between sites is very marked though, with some sites (e.g. site 1) having very few events and some weeks with no significant events detected at all.
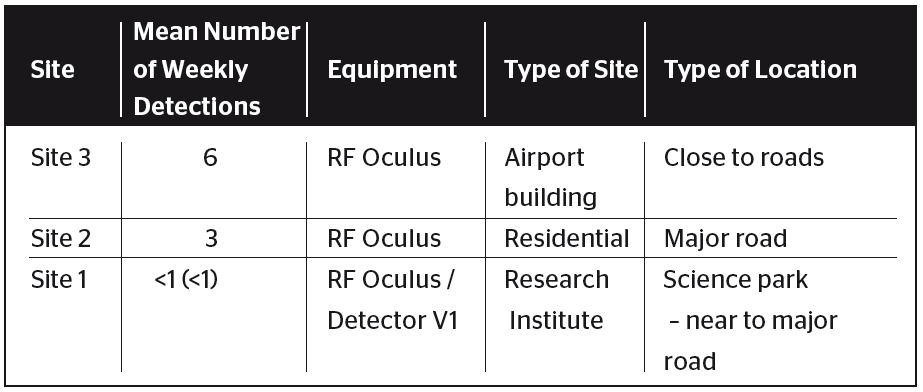
Looking at the overall number of significant detections, it is interesting to see if the number of detections has any correlation with the type of site. The list of sites in decreasing number of mean weekly number of significant detected events is given in Table I and Table II. In the tables, the sites with RF Oculus and Detector equipment are separated because they may report in a different way.
TABLE I. OVERVIEW OF MEAN WEEKLY NUMBER OF DETECTED SIGNIFICANT EVENTS FOR EACH SITE WITH DETECTOR EQUIPMENT
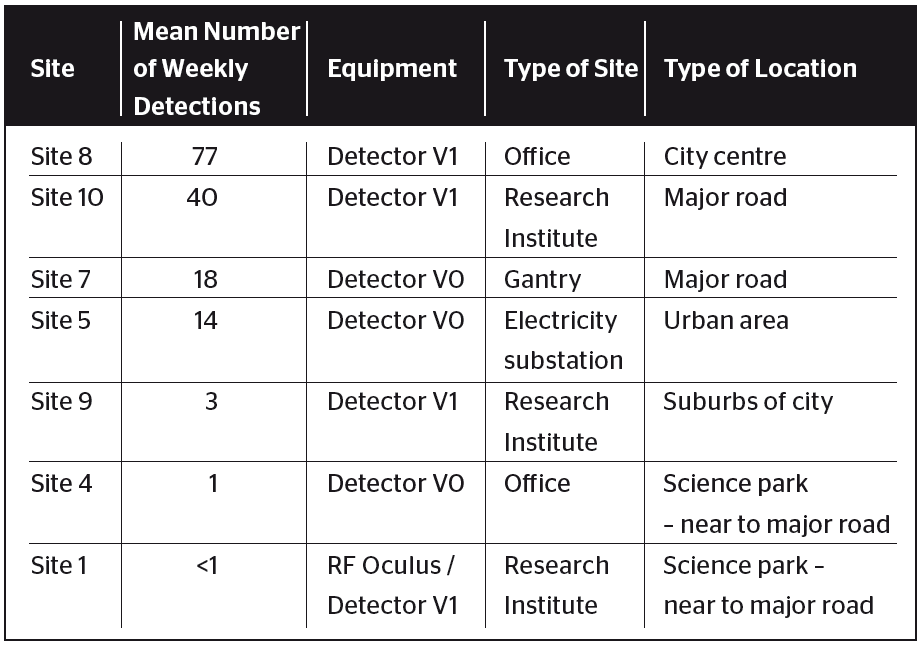
TABLE II. OVERVIEW OF MEAN WEEKLY NUMBER OF DETECTED SIGNIFICANT EVENTS FOR EACH SITE WITH RF OCULUS EQUIPMENT
Busy locations in the city center and next to major roads have the most activity, whereas more remote sites are a lot quieter. As we expect the majority of intentional jamming signals to originate from in-vehicle jammers it makes sense that we see this correlation. If all these detected events were due to jammers that would correspond to 11 per day at the most active site (site 8).
Finally, it is interesting to compare the occurrence of different types of event at each site to see if there are any patterns that can be observed. This analysis is completed for the sites with Detector probes as they are easy to compare statistics. Table III shows the mean weekly number of detections of different types of classified signal at each site.
It can be seen from Table III that certain aspects are self-evident, for example site 8 has the greatest number of detections of each type of event and this is also the most active site in terms of total number of detections. However, there are other findings that are less intuitive. For example, the greatest number of chirp type events (which are likely to be intentional and are associated with vehicle jammers) are seen at site 8 and site 10, with a significant number also seen at site 5. Those three sites are close to busy roads and hence that probably explains the high number of these types of events. However, site 7 is also close to a major road but this one sees far fewer events so it is interesting why that is the case – whether there is a difference in the interference between different countries, or the type of traffic on that road is different to other sites.
TABLE III. OVERVIEW OF MEAN WEEKLY NUMBER OF DETECTED SIGNAL TYPES FOR EACH SITE WITH DETECTOR EQUIPMENT
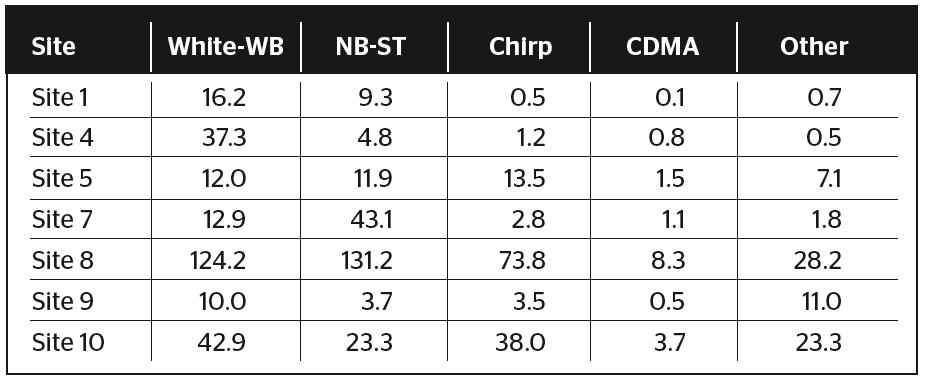
Looking in more detail at site 9 it appears that a lot of the ‘other’ events have low power and the classification algorithm cannot determine with confidence what type of signal they are, but visual inspection of the spectrum and spectrogram shows that there may be chirp signatures hidden within there – just at very low power. So in reality the figures for detected chirp events are probably a bit higher than reported in the tables.
Site 10 also has a high number and percentage of ‘other’ signals. Again, looking in detail a lot of these appear to be chirp-like signals, but are slightly more unusual than the typical swept chirp signals and so are sometimes classified as frequency hopped rather than chirp.
Overall, it can be seen that the sites that detect the most chirp signatures (which are likely to be intentional) are close to major roads and built up areas (sites 5, 8, 9 and 10), although at site 9 many of the events are at low power (so probably some distance away) which makes them difficult to classify as chirp with high confidence.
Detailed Site Analysis
This section contains a detailed analysis of the interference events reported for some of the monitored sites. Summary statistics over the monitoring period (up to 3 months duration) are presented for two selected sites, as well as a detailed analysis of particularly interesting events.
A. Site 3
Site 3 is an airport in mid Sweden, where RF Oculus is installed on the rooftop on one of the buildings. The surrounding has intense traffic of trucks, cars, taxis, buses and airplanes. This site was installed in March 2016.
There were in total 163 interference events registered by RF Oculus, 80 of the events have a duration larger than one second. The majority of the events happens during working hours. However, it is interesting to notice that there is a very sharp difference in the numbers of events on each day, and the events are limited to only a few specific hours in each day, see Fig. 6.
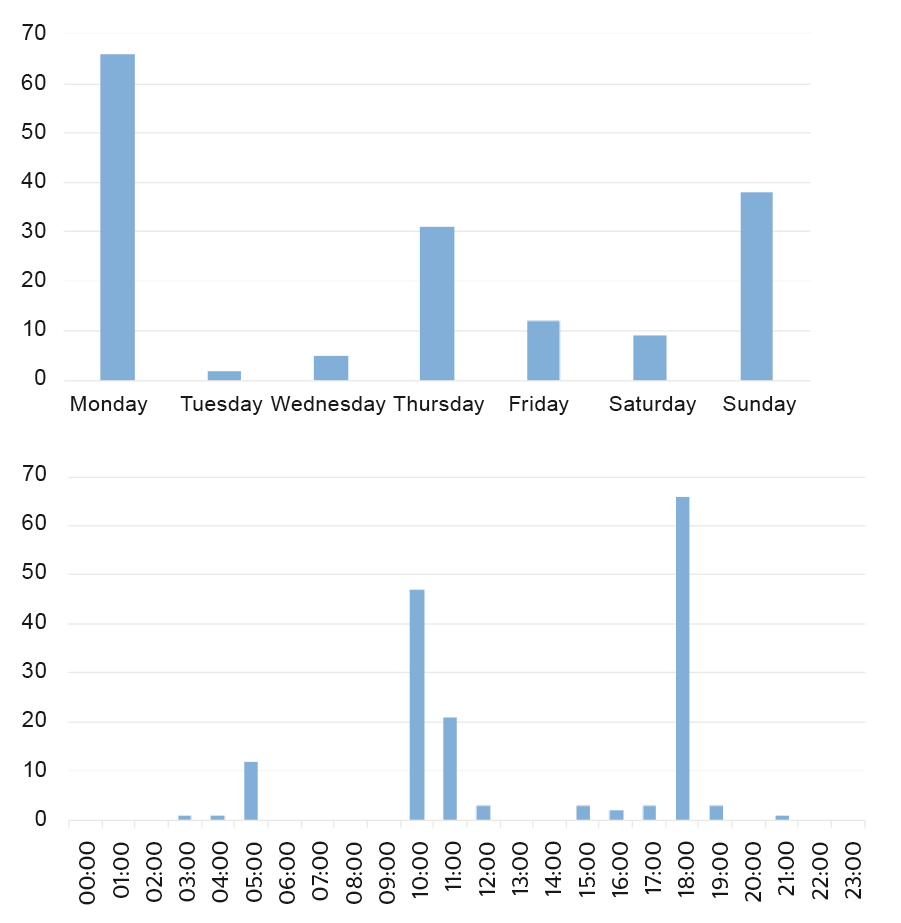
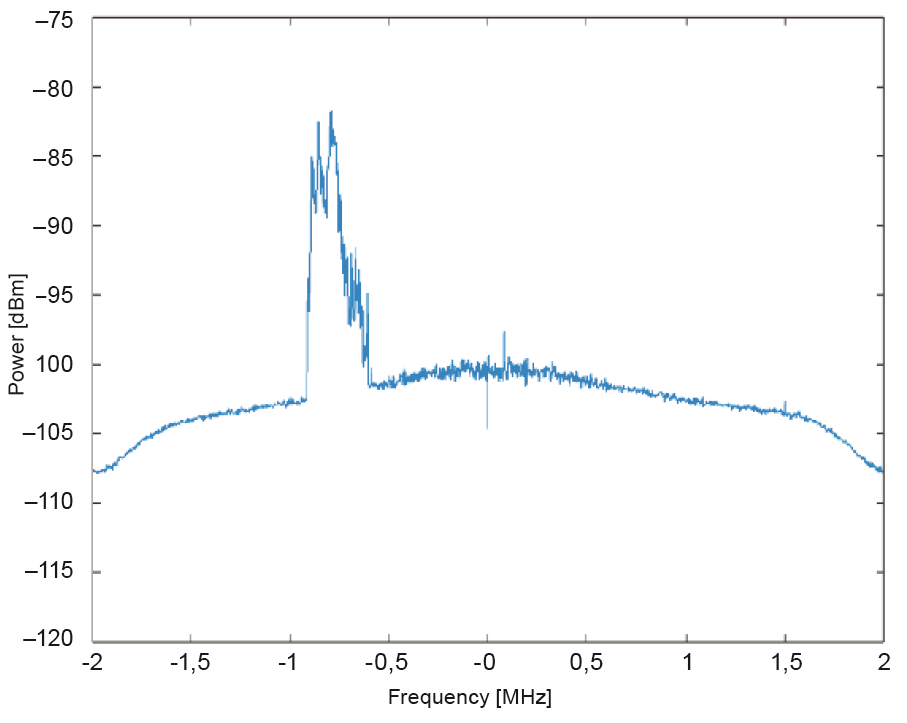
One example of a detected interference event at Site 3, is shown in Fig. 7. The interference is classified as constant envelope by the system. The interference event last for 13 seconds and there was a decrease in the co-located GPS receivers C/N0 with approximately 10 dB.
B. Site 8
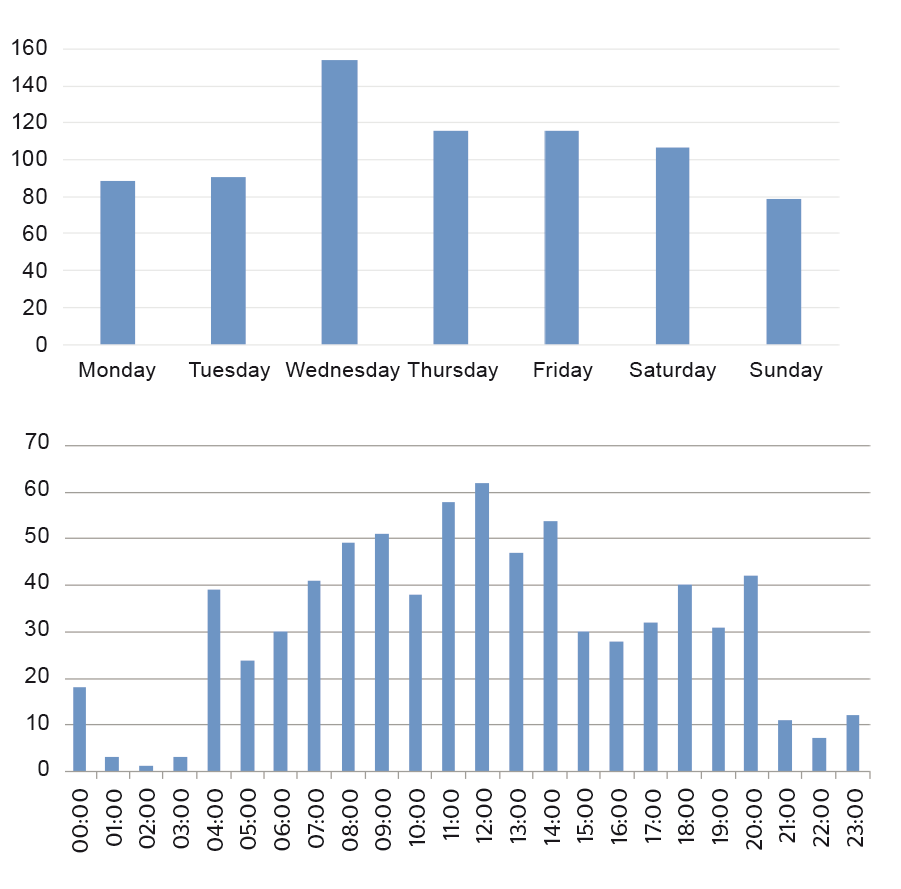
Site 8 is an office building located centrally in a major city and is close to several busy roads. This site was installed in April 2016 and hosts a Detector V1 probe, linked to the back-office and STRIKE3 database at NSL.
Overall there are over 3000 potential interference events detected in this 2-month period, which shows that this is a highly active site with a great deal of interference. A lot of these events are classified as white-WB or NB-ST, but even so there are still 643 events classified as chirp, which are indicative of jammers. It is also interesting to look at the distribution of events in terms of the day of week and time of day that they occur. This analysis, covering all high priority events in the 2-month monitoring period, is shown in Fig. 8. Note that the time plot displays time in UTC, and hence local time is 2hrs ahead of this.
period.
It can be seen from the results that events occur on all days and can occur at any time of day, although there is some increased likelihood on working days and during working hours. This is the sort of pattern that would be expected if the interference was linked to human activity.
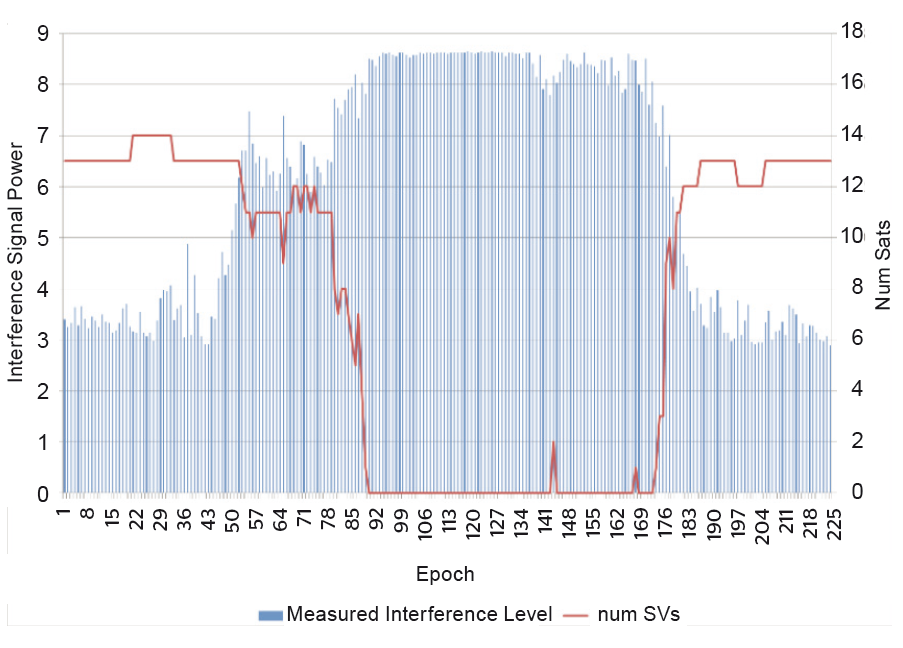
Although there are a lot of events detected at Site 8, in many cases there is not a significant impact on the GPS tracking. However, there are other events where the interference signal is received with higher power level and the tracking and positioning is affected. One of the most significant is one that was detected on 22/06/16. The measured power level and the impact on the signal tracking is shown in Fig. 9. It can be seen that for this event the measured power level for the interference was high (9 is the maximum) and that tracking of all satellites was lost for some time. In total this event lasted for 7.5 minutes.
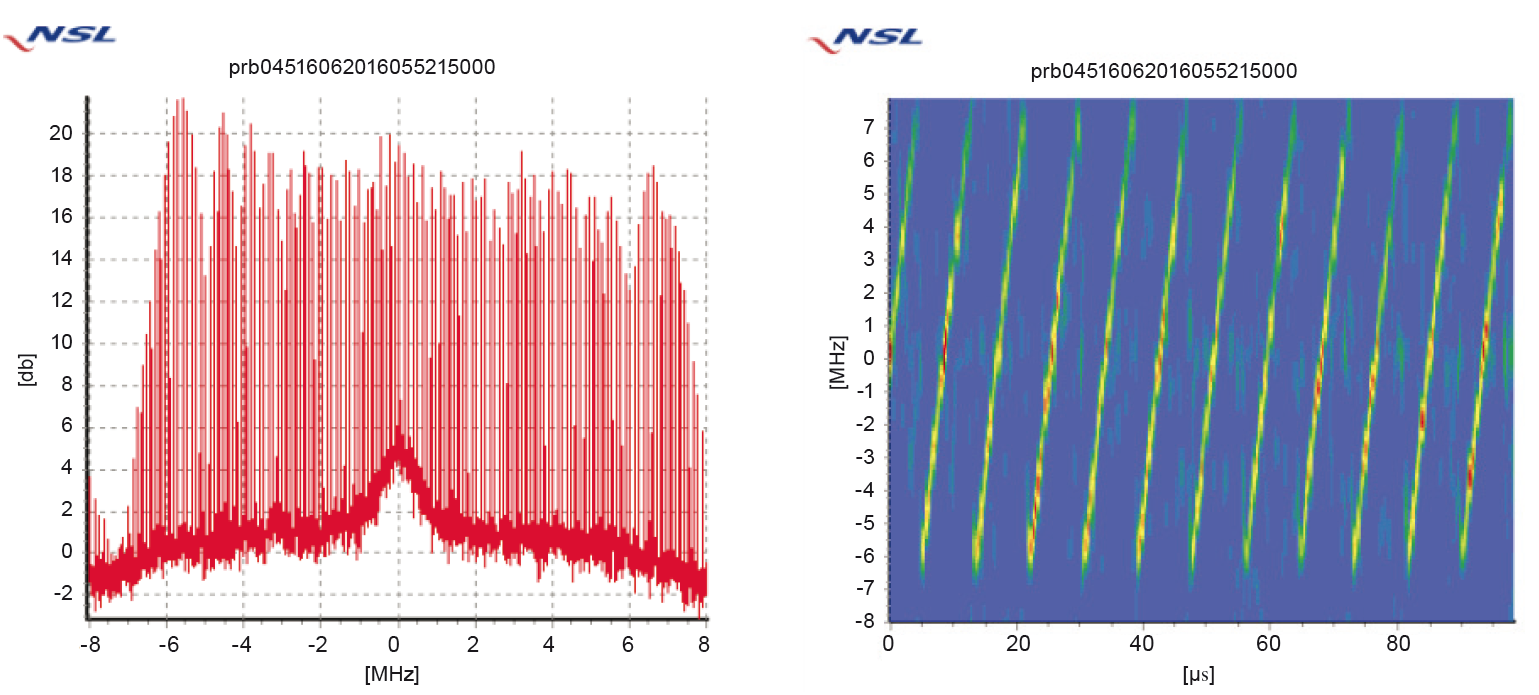
If we look at events classified as chirp signal, it can be seen that there are a variety of different signatures that have been detected. One example of a detected chirp signal is provided in Fig. 10. Chirp signals is very common for GPS jammers sold on the Internet.
Way forward
Since this measurement campaign was carried out in spring 2016 the work has proceeded in the STRIKE3 project. A draft of a standardized threat reporting message has been developed based on the experienced from the measurement campaign and analysis in 2016.
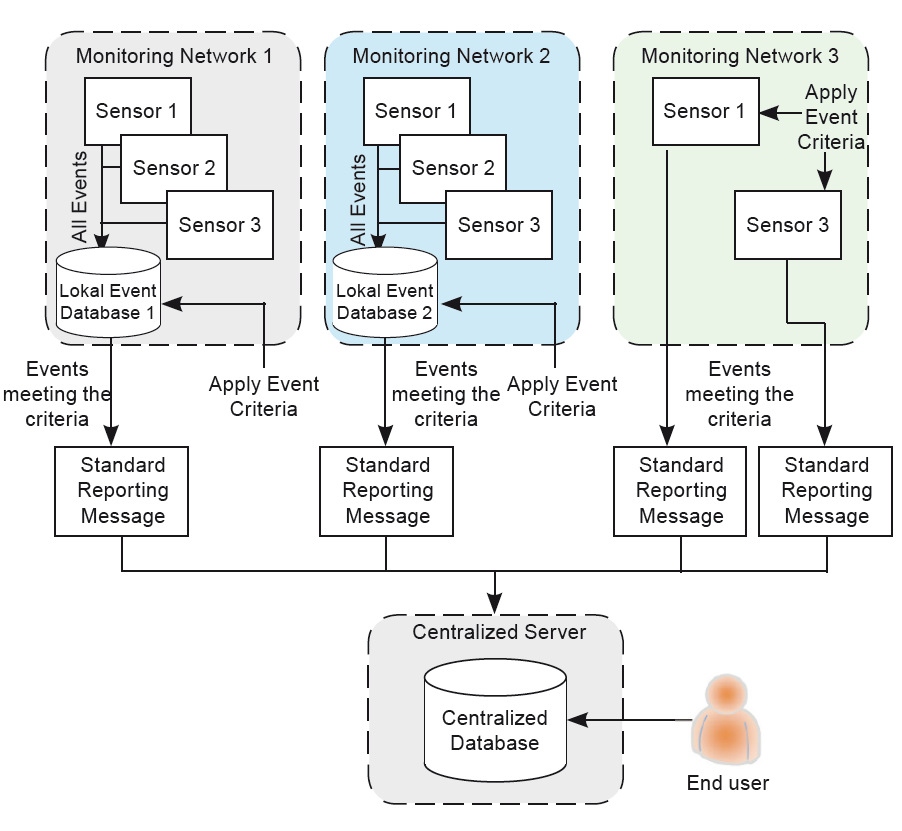
The purpose of the standardised threat report message and event definition is to facilitate the integration of existing threat monitoring systems into an international threat monitoring network with a central database to collate the incidents that are encountered by the various monitoring systems in the network. The overall system concept to implement this approach consists of two main elements:
- Sensors (for detecting interference and reporting events),
- Centralised server (for collating reports from the different sensors in a centralized database and providing access to the results for end-users).
As shown in fig. 11, the sensors are operated independently of the centralised server. It is the intention to allow different types of detection equipment from different manufacturers to be used for interference monitoring, and to enable already deployed sensors and monitoring networks, as well as new installations, to contribute to the centralised database. The centralised server will act as a central hub to collect results from different sensors deployed in a variety of monitoring networks, and allow end-users to view information about the events and generate statistics.
The logic of this approach is as follows:
- Sensors will be used to detect interference events. The sensors may be deployed in a monitoring network where they report to their own local event database or the sensors may store data locally at the sensor.
- Only high-level information about interference events that are detected by the sensors will be provided to the centralised server for storage in the centralised database following the proposed standards.
- The events detected by the detection equipment at the sensors must be verified against standard event criteria as a pre-filtering step. This pre-filtering can be done either at a local network database (as in ‘Monitoring Network 1’) or at the sensor itself (as in ‘Monitoring Network 3’).
- Those events that meet the event definition criteria must be formatted according to the reporting standard before they are provided to the centralised server.
- A minimum set of mandatory information is defined for all events.
- Optional fields are also available to allow organisations to provide additional information that is interesting for more detailed analysis if so desired.
- Possible analysis will allow an overview of the global threat situation and change of threat level over time.
- This provides a mechanism for end-users to obtain additional detailed information about certain events from the organisation that owns the data.
Currently a new measurement campaign has started in 2018 and will last for 11 months. During this measurement campaign all the monitoring networks are connected to the centralized server through the proposed threat reporting message and infrastructure.
Conclusion
Weekly numbers of detected GNSS interference events were analysed. It was seen that interference events have been detected at all sites although there is a huge variation in the number of weekly events at each site, with some sites having only a few detections per week whereas others have several hundred. Not all detections are intentional interference of course, and many are low power or last for very short time periods. Considering only those events deemed ‘significant’ leads to a much smaller number of events. Nevertheless, the most active site still has over 100 detections of significant events in some weeks, which corresponds to approximately 15 events per day.
The most active sites appear to be those next to major roads or in city center locations. These are also the busiest sites in terms of vehicles (which may carry jammers) and other sorts of activity. Sites that are further from major roads and in less busy areas have far fewer significant events detected, showing the strong link between vehicle and human activity (which are the likely causes of intentional interference) and interference events. It is also clear from these overall results that although total numbers of events are interesting and give an indication of activity, they do not provide information on the nature of the interference, the likely cause, and whether it has an impact or not.
In terms of impact, many events do not have any noticeable impact on GPS tracking performance of the COTS receiver. Nevertheless, for many chirp type events (which are after all designed to block GPS tracking), and for other types of signal received with high power, GPS tracking can be impeded and even lost altogether. This has been observed both for the COTS receiver within the Detector probe and also at other co-located equipment. It is also noticeable at one location that the COTS receiver within the Detector probe reported very large position errors (hundreds of metres) during some interference events
Long term monitoring at these sites and new locations is continuing throughout the STRIKE3 project. In the future this will be done through the use of common reporting standards, to allow standardised reporting (and analysis) of events from RF Oculus, Detector and other systems.
Acknowledgments
The work presented in this paper has been co-funded under the H2020 programme through the European GNSS Agency (GSA).
Patrik Eliardsson, Erik Axell, Mikael Alexandersson, FOI Michael Pattinson, NSL