


In certain applications it is of highly importance to be able to identify unintentional pulsed interference sources. One reason is that this kind of interference can cause severe performance degradation of modern digital wireless communications. In this paper we show that pulsed interference sources can be identified by standard radiated emission measurements performed in the frequency domain.
We show that by measuring with an average detector and a root-mean-square (RMS) detector, pulse repetition frequencies from hidden pulsed interference can be extracted from the spectrum and identified for trouble-shooting and assessment, especially in outdoor measurements where a lot of background signals are mixed in the measured spectrum. The method is demonstrated on a real case where undesired pulsed interference is identified in a high-voltage installation and the actual source of the interference could be identified.
I. Introduction
In general, pulsed interference causes stronger performance degradation than other interference signals on modern digital wireless communications. For different interference waveforms the performance degradation in terms of the bit error probability can vary by several orders of magnitude for the same interference signal power [1]. Therefore it is of highly importance to be able to identify unintentional pulsed interference sources in certain applications.
In standard radiated emission measurements the frequency band of interest is swept with a spectrum analyzer with a certain measurement detector. The result is typically shown as electric field strength versus frequency. In such spectrum measurement it is often difficult to identify different interference signals unless they are of very fundamental type such as sine waves and modulated signals. If, for example, a pulsed signal such as a square wave or corona signal is present, these signals can be very difficult to identify since their spectrum can be hidden in the total spectrum measured. The latter is typically the case in outdoor measurements where the background noise makes the measured spectrums very complex.
Another example is measurement of radiated emission from high-voltage installations. This radiated emission typically contains a large mixture of signals such as corona and different kinds of signals from switched electronics. Damaged components such as circuit breakers typically give pulsed interference which, if identified, can be of crucial help in trouble shooting.
Another example of complex emission spectrums occurs in measurements of man-made noise in urban environments. To make a proper analysis of how such interference spectrum affects a digital radio system it is of vital importance to identify possible pulsed signals in the total spectrum. Thus, there is a need to be able to extract information about interference signal content from spectrum measurements.
In this paper we show how information about pulsed interference signals can be extracted from traditional spectrum-analyzer measurements without any requirement of performing special dedicated time-domain measurements. The method explores the fundamental properties of two measurements detectors, the average detector and the root-mean-square (RMS) detector. By knowledge of the properties of these detectors, information about pulsed interference can be extracted from frequency measurements.
The paper is organized as follows. In section II, the method is presented. The theory behind the method is very simple and straight forward since it is based on the conventional measurement of IR. The basic idea is to explore the different detector properties for pulse interference. In section III we demonstrate the method by comparison of estimated content of pulsed interference signals with time-domain measurements. It is shown that the method proposed agrees well with time-domain measurements and that the interference properties of an undesired gap discharge in a high-voltage installation could be identified with this method. The paper is concluded in section IV.
II. Theoretical description of the method from antenna
A well-known measure of the impulsive properties of noise is the Impulsiveness Ratio (IR). The IR is defined as [2]
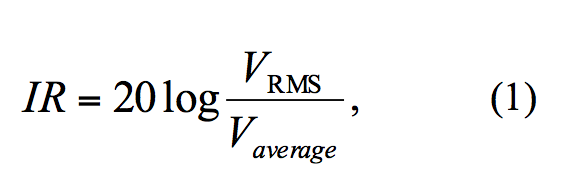
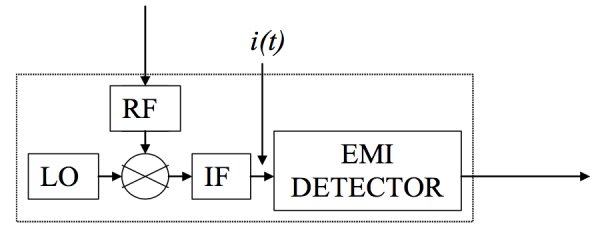
where VRMS and Vaverage are the root-mean square and time average values of the envelope i(t) of the output of the IF (Intermediate Frequency) filter of a measurement receiver, see Fig. 1. It is important to have in mind that the RMS and average values are measured on the envelope of the IF output, not on the signal reaching the RF stage.
For example, the IR for a sine wave is equal to 1 [dB]. The IR for Gaussian noise is 1.1 [dB]. In emission measurements the corresponding electrical field strengths are ERMS and Eaverage. By exploring the properties for pulsed interference signals for these two detectors, it is possible to draw conclusions of the signals behind the frequency spectrum. For periodic pulses with pulse repetition frequency fp, passed through an IF-filter with bandwidth WIF, the responses ERMS and Eaverage of these detectors can be written as [3]
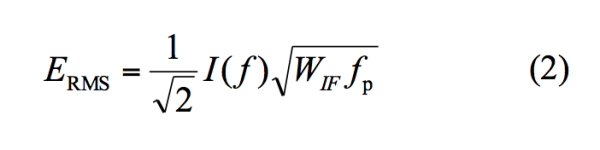
and
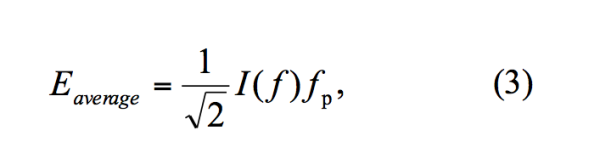
where I(f) is the Fourier transform of the disturbance signal at the frequency where the measurement is done. WIF is the impulse bandwidth of the measurement equipment. Equation (2) is based on the assumption that fp < WIF and that the pulse duration Tp << 1/WIF (no overlap after the IF-filter). By using (2) and (3) in (1) the IR can be written as
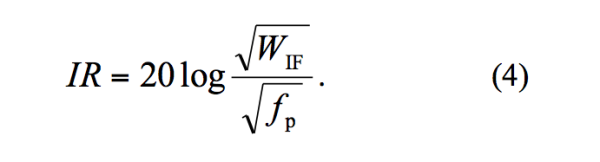
From (4) it is possible to derive the pulse repetition frequency if the IR has been measured and calculated with (1). Thus, by performing a radiated emission measurement with a spectrum analyzer and two detectors, average and RMS detector, possible pulsed interference signals can be identified in the spectrum without the need of time-domain measurements. Since (4) is valid for pure pulsed interference, the application of this equation on a spectrum with a mixture of signals will result in a distribution of possible pulse repetition frequencies in the spectrum.
However, (4) is very sensitive to any pulsed interference signal, other signals such as sine waves and Gaussian noise will have a small impact on the IR. Thus, (4) is an efficient discriminator between pulsed interference and other fundamental signals.
III. Comparison between measured and estimated PRF on real case
The method is demonstrated by comparison with time-domain measurements in a real application. The radiated emission was measured with a loop antenna in the vicinity of a high-voltage installation in the frequency region 9 kHz – 30 MHz. The measurement bandwidths were according to CISPR 16-1-1 which are 200 Hz for frequencies below 150 kHz and 9 kHz for frequencies above 150 kHz. The RMS- and average values of the electric field strength are shown in Fig. 2.
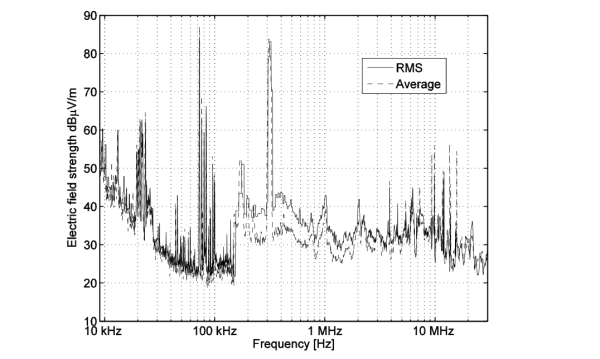
The peak at 315 kHz is a Power-line Communication (PLC) channel on the 400 kV line. There are also PLC:s at 72, 76, 80, 83.5 and 96 kHz. There are radio transmissions at 170 kHz, 195 kHz and 225 kHz. A major difficulty with outdoor measurements is that there often are a lot of man-made signals in the background. Therefore it can be difficult to identify other undesired interference hidden in these signals. Equation (4) was used to identify any such hidden pulsed-interference signals.
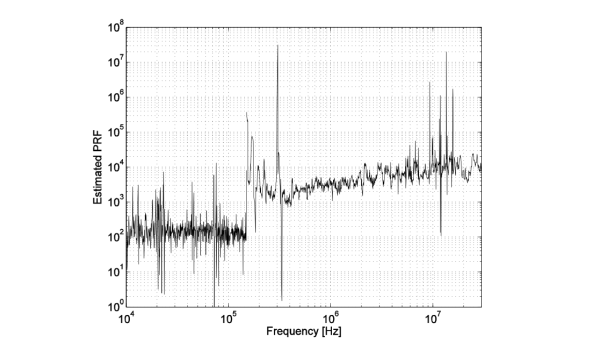
In Fig 3 the estimated content of pulse repetition frequencies are shown and these are clustered in two groups, one around 100 Hz (approximately) and one around 2.5-3 kHz (approximately). Since the signal is a mixture of different waveforms the diagram exhibits a noisy shape around the estimated pulse repetition frequencies. Furthermore, the RMS- and average detector measurements have been done at slight differences in time which causes small variations in the spectrums. The change at 150 kHz is caused by a change in the measurement bandwidth from 200 Hz to 9 kHz. Measurements with 200 Hz bandwidth can not identify the pulse repetition frequency around 2.5-3 kHz since the requirement fp < WIF is not satisfied.
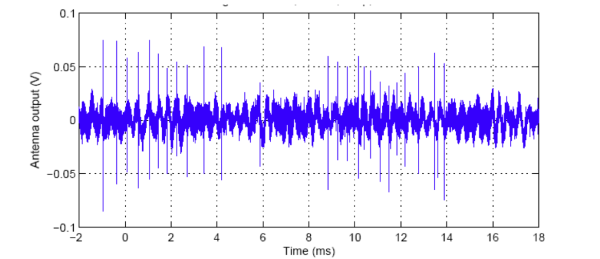
In Fig. 4, a time-domain measurement by oscilloscope is shown for comparison. The signal consists of bursts occurring every 10 ms (corresponding to 100 Hz) and in the burst the time between the single burst components is about 0.3-0.4 ms (corresponding to 2.5-3 kHz). Thus, by using the RMS- and average values of the frequency spectrum, the two dominating frequencies can be found with this method. The source was identified as gap discharges. In high voltage installations this may be caused by bad contact between caps and pins in insulator strings, by corroded contact surfaces of bolted connections in steel constructions or by loose metal parts.
IV. Conclusions
In this paper we have shown a novel method to identify pulsed interference in radiated emission measurements performed in the frequency domain. With this method pulsed interference signals can be identified even in spectrums of complex nature where a mix of interference signals is present. This is always the case in interference measurements in real applications where no shielded rooms exist or can be used to decrease man-made noise. Since pulsed interference can cause severe performance degradation on digital radio communications, this method can serve as a simple but powerful general tool to extract troublesome interference signals from complex frequency spectrums of radiated emission. Furthermore, the method can for instance be used in general for trouble shooting in applications where damaged components result in pulsed interference.
Acknowledgements
The authors wish to thank ABB Power Systems and Svenska Kraftnät for financing the measurements in this work.
Peter F. Stenumgaard 1), Lars-Erik Juhlin 2), Erling Pettersson 3), Jenny Skansen 2) 1) The Swedish Defence Research Agency 2) ABB Power Systems 3) STRI AB
References
[1] Peter F. Stenumgaard, “A Simple Impulsiveness Correction Factor for Control of Electromagnetic Interference in Dynamic Wireless Applications”, IEEE Communication Letters, vol. 10, NO. 3, March 2006.
[2] ITU Document “The Protection of Safety Services from Unwanted Emissions”, AMCP WGF/6 WP/6, Document 1/13-E, 30 October 2000.
[3] D. B. Geselowitz,”Response of Ideal Noise Meter to Continuous Sine Wave, Recurrent Pulses, and Random Noise, ”IRE Transactions on Radio Frequency Disturbance, May 1961.