


FOI is establishing a facility . for destructive HPM testing and is developing an envisaged test methodology for such tests. The methodology consists of two test phases: (1) Determine the lowest power density required to destroy an object within a frequency range, using a reverberation chamber. (2) At this frequency, determine the most sensitive direction of attack using an HPM generator. A reverberation chamber and an HPM-generator adequate for such tests are presented together with early results from destructive testing of electronic systems in a reverberation chamber.
Electromagnetic interference (EMI) with electronic equipment and systems can be caused by natural phenomena as lightning and static electricity, but also unintentionally by switching surges or electric loads influencing the power quality. In addition to the unintentional EMI, interference can occur intentionally. Intentional EMI (IEMI) is a manmade interference with the objective to disturb or destroy electronic equipment.
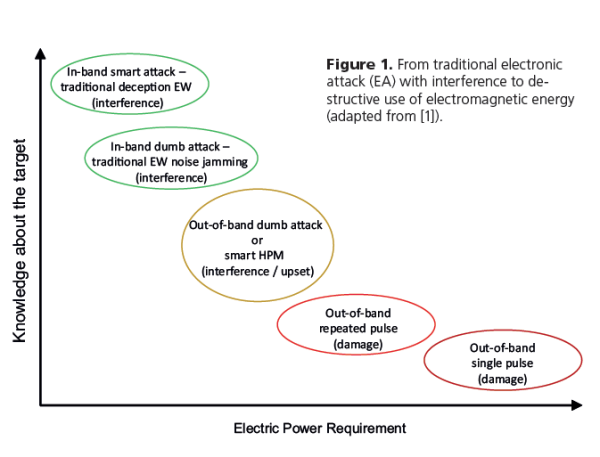
The IEMI is common in the military context, where it in its broadest sense is called electronic attack (EA), which is one constituent in electronic warfare (EW). EA spans from jamming of electronic signals to the destruction of electronic hardware, see Figure 1. For the destruction of electronic components and equipment, powerful high-power microwave (HPM) generators are required.
The development of HPM generators [2] [3] has reached a sufficient maturity for weaponization and for taking the step from the laboratory into the tactical arena [4][5].
Another indication of the actuality of the threat is that high-power electromagnetic environments and their effects have been introduced in various standards, such as the IEC 61000-series [6] and US Department of Defense MIL-standards, e.g. [7].
When studying effects of EMI disturbance and jamming, low-level tests can be performed since the system responses are linear. However, when studying destructive effects, the system response becomes non-linear and scaling from low-level tests will not be possible. To be able to perform tests in the destructive, non-linear regime, FOI is developing a relevant test methodology and appropriate facilities.
Test methodology
In general, susceptibility testing of electronic equipment is demanding since the electromagnetic coupling into an object is strongly dependent on frequency, polarization and direction of incidence [8]. Thus, during an HPM test, the device under test (DUT) must be irradiated in a broad frequency interval (at least the S-band, 2-4 GHz), from all directions and with at least two polarizations.
Destructive HPM testing of electronic equipment requires that the DUT is subjected to very high power densities, usually on the order of several hundred kW/m², or over 10 kV/m [9]. Such a high power density can be achieved using an HPM-generator, which typically is a free electron vacuum device that delivers a few tens of megawatts up to several gigawatts of microwave power.
However, these generators are not generally frequency-tunable, meaning that a separate HPM-source must be used for each frequency to be tested. A consequence of this is that destructive, or interfering, HPM-testing of electronic equipment is usually performed only at one or a few, preset, discrete frequencies [10]. It is possible to design a low level (megawatt) type of HPM-generator that is able to produce threat levels at the small distances required for testing purposes and that can be frequency-tuned by changing the geometrical dimensions inside the generator.
But this kind of frequency tuning usually includes breaking the vacuum and exchanging the physical parts that determine the operating frequency. This is especially true if the frequency needs to be changed more than about 10 %. Smaller frequency adjustments (<10 %) can sometimes be obtained by external control of the interior geometry. Hence, direct HPM-testing at more than one single frequency will be extremely time-consuming.
In order to cover a wide frequency span and to be able to test at many frequencies in this band, destructive testing can be divided into two phases. The first phase will consist of high level testing in a reverberation chamber (RC), where very high power densities are relatively easy to obtain with a limited amount of input power [11]. The RC-test will give information on at which power densities and frequencies the DUT breaks. With this information it is then possible to use a small, megawatt class, HPM generator that is tuned to the desired frequency and irradiate the DUT directly in an anechoic chamber. This step will give the needed additional information regarding the angular sensitivity of the DUT.
In summary, the proposed test method consists of the following two test phases:
- First, the DUT is tested in RC where the minimum power density required to destroy the DUT is established and at which frequency this occur.
- Second, the DUT is tested for its most sensitive direction of attack and polarization using a frequency-tuned HPM generator.
To realize this test method, designated RC and HPM generator must be developed. These are described in the following two sections.
Description of reverberation chamber
Narrow-band HPM-pulses are short, usually on the order of 100 ns up to one or a few microseconds, which implies that an RC designed for HPM-testing must reach the test level of electric field strength within this time frame. This means that it needs to have a small time constant.
The time constant of an RC is the figure of merit of how fast the RC reacts to changes in the driving voltage and is defined as the decay, or fall, time of the electromagnetic energy in the cavity according to where Q is the quality factor of the cavity and ω is the angular frequency of the electromagnetic wave in the cavity.
It is possible to reduce the time constant of an RC by introducing lossy material into the chamber, thus decreasing the quality factor, but this will also decrease the field level that can be achieved with a given amount of input power. The normalized E-field that describes the relation between input power and electric field level inside the RC will decrease when losses are introduced. In a physically small RC it is possible to obtain both high normalized E-fields as well as a small time constant.
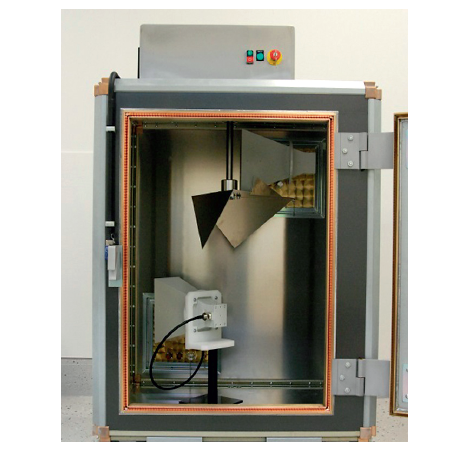
The RC described here was designed and delivered by Siepel and has an internal volume of 1.24 x 0.98 x 0.82 m³ and a working volume of 0.72 x 0.56 x 0.4 m³. The lowest usable frequency was specified to 1 GHz or lower.
Using the internal dimensions given above, the following approximate formula gives the number of modes, N, at frequency f [12]
 where L, W and H are the internal dimensions of the chamber. For this chamber the number of modes at the specified LUF is N=310 and Siepel uses the criteria N>100 to consider the chamber usable [13]. A photograph of the RC is given in Fig. 2.
The performance of the RC is given in Fig. 3, Fig. 4 and Fig. 5.
Fig. 3 shows the normalized E-field as a function of frequency as measured according to DO-160 [14]
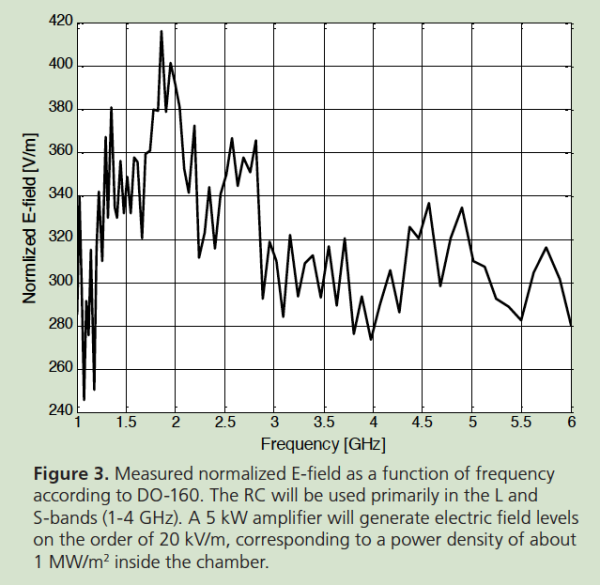
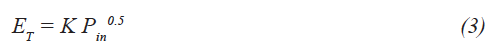
and Fig. 4 shows the measured time constant as a function of frequency. The relationship between the microwave power input into the RC, Pin, and the electric field strength in the working volume, EΤ, is
where K is the normalized electric field as given in Fig. 3 and ET refer to the maximum of the total field. With an S-band (2-4 GHz) power amplifier of 5 kW, the electric field strength, ET, in the working volume is about 20 kV/m when the chamber is calibrated according to DO-160.
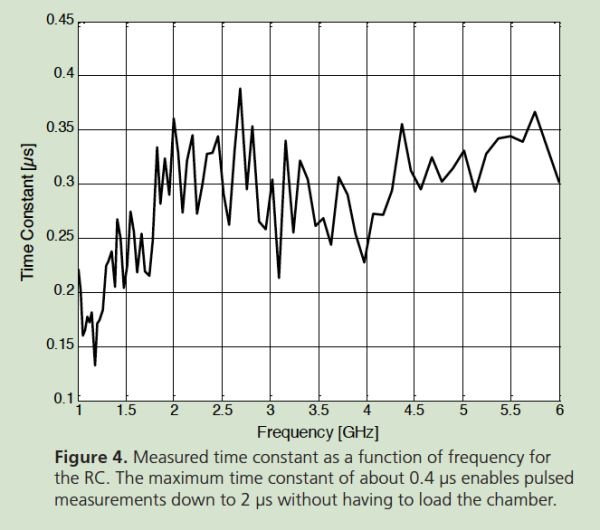
Fig. 5 shows the measured field uniformity for frequencies between 1 GHz and 6 GHz from empty chamber calibration with 9 probe positions. It is seen here that the standard deviation of the field uniformity is lower than the 3 dB stipulated by the standard all the way down to 1 GHz which is the specified LUF.
The DO-160 standard stipulates that for pulse testing the sum of the rise and fall times of the cavity must be smaller than 40 % of the pulse length. Hence, with an empty chamber time constant that is smaller than 400 ns, Fig. 4, it is possible to perform pulsed RC-testing down to 2 μs pulse length without having to load the chamber.
Description of HPM-generator
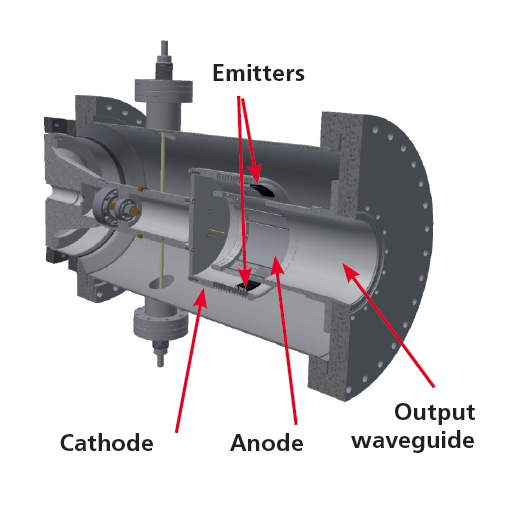
A virtual cathode oscillator (Vircator) is a compact and robust HPM generator [3]. As the name implies it is not an amplifier but an oscillator designed for a specific frequency of oscillation. In the most basic version of the vircator, the operating frequency depends only on the distance between the anode and cathode and the applied voltage.
FOI has designed and built several different vircators with an output power between a few megawatts up to hundreds of megawatts [15]-[18]. The vircator that is being modified for use in HPMtesting is a so called coaxial vircator with sectioned emitter that generates a TE11 mode in a cylindrical waveguide connected to a medium gain horn antenna [17].
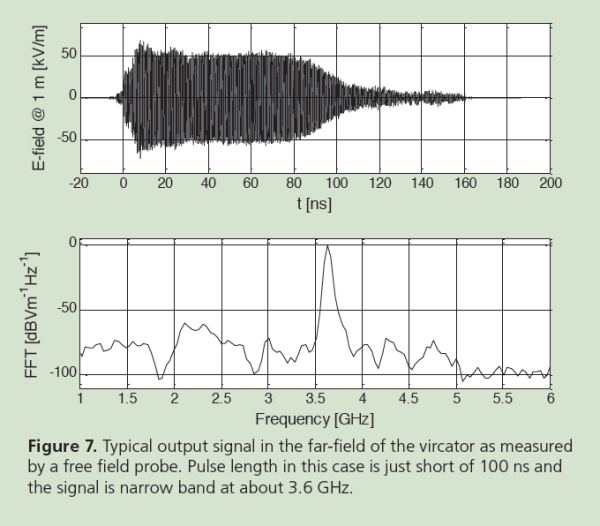
Figure 6 shows a CAD-drawing of the vircator with waveguide output but without the horn antenna. This system can produce a power density on the order of 10 MW/m² over an area of a few square decimeters where the far field of the antenna begins, see Fig. 7. For testing at a lower power density objects are simply moved further away from the antenna.
The polarization is changed by rotating the cathode so that the direction of electron emission and hence the polarization of the TE11 mode is changed. This simplifies testing of large objects that can be difficult to rotate around the axis of propagation of the radiation in order to facilitate testing at different polarizations.
The vircator is powered by a 400 J, 400 kV Marx generator charged by a switching power supply with a programmable duty cycle control to regulate the charging current. The Marx generator can be operated in single shot mode as well as repetitively up to a repetition rate of 10 Hz. It is primarily the power supply that sets the pulse length for the generated microwave signal from the vircator; if a longer or shorter pulse is needed the power supply needs to be replaced.
Results from destructive testing in reverberation chamber
Destructive testing of individual components by direct injection of electromagnetic energy has been reported in the literature [19][20], where Tasca [20] offers a three dimensional model with continuous time derivate for the energy as a function of pulse length required for the permanent damage of an isolated integrated circuit:
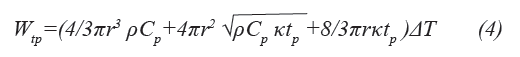
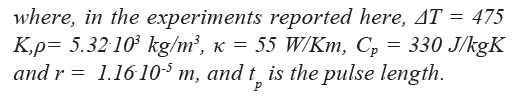
The Tasca curve, valid for an isolated semiconductor device, should be applicable to an electronic circuit or system consisting of many integrated circuits and other components when subjected to an incoming electromagnetic pulse. In this context however the energy given by the Tasca curve needs to be multiplied with a factor that expresses the coupling between the energy density in the pulse and the energy needed for destruction of a circuit. That is, the energy density, wsys, required to destroy an electronic system follows the formula
where Cf = Cf (f) is a frequency-dependent geometrical factor that corresponds to the coupling of energy in the electromagnetic field to energy deposited inside the integrated circuit. To test this hypothesis, a simple battery-powered electronic circuit was subjected to destructive testing in the reverberation chamber previously described, see section ”Description of reverberation chamber”.
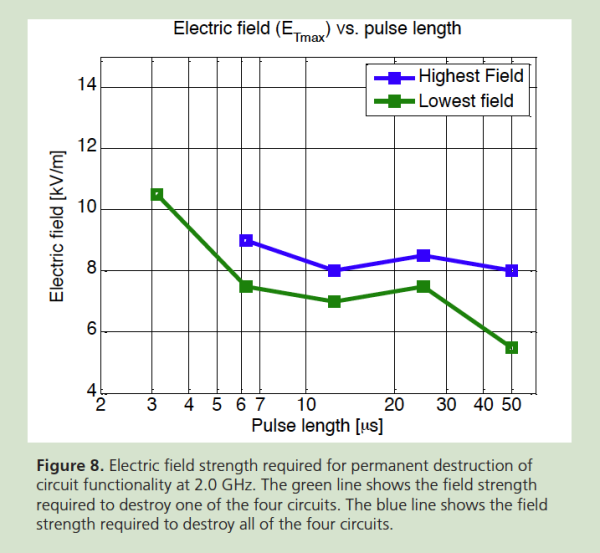
The DUT used was a simple battery-powered electronic circuit with one integrated circuit and three other semiconductors. All semiconductors were mounted in sockets so that they could be replaced between individual tests. The objective of the test is to find the electric field level necessary to permanently destroy the DUT, with the pulse length and the microwave frequency as parameters that are varied. The test procedure was as follows: For a given pulse length and microwave frequency, the electric field strength was increased stepwise by 1 dB and after each application, the functionality of the circuits was examined. The electric field was increased until all individual DUTs were destroyed. In the experiments reported here it was always the same component, the integrated circuit, that was destroyed.
Figure 8 shows the electric field strength required for permanent destruction of circuit functionality at 2.0 GHz as a function of pulse length. The figure gives the field strength at which the first of the four circuits is destroyed and the field strength at which the last of the four circuits is destroyed. At a pulse length of 3 μs, it was not possible to achieve sufficiently high field strength to destroy all circuits.
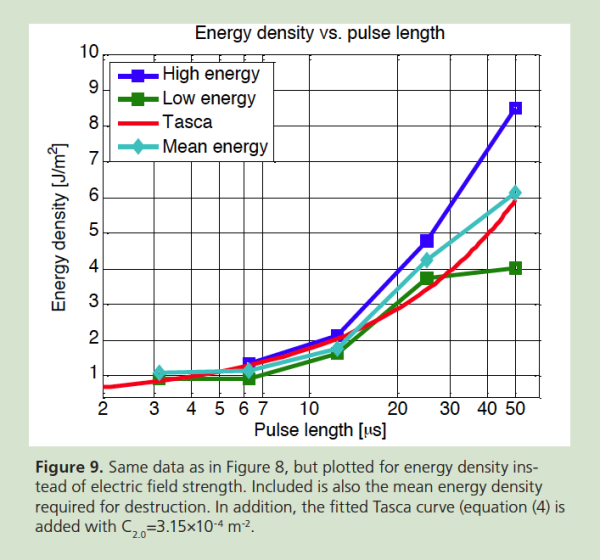
Figure 9 shows the same data as in Fig. 8, but plotted with the ordinate in energy density instead of electric field strength. The figure also includes a Tasca curve fitted according to equation (2) with C2.0=3.15°—10-4 m-2, showing good general agreement.
Discussion
There is an obvious discrepancy between the shortest pulse that can be achieved in the RC without loading it and the longest pulse that can be achieved with the vircator. The shortest pulses that can be used in the RC without having to load the chamber is about 2 μs and the longest pulse obtained by using the vircator is one or a few hundred nanoseconds, so there is a gap in pulse length between the two systems that needs to be bridged. There are two basic ways of closing the gap.
The first way is to load the chamber to shorten the rise time and accept the fact that a more powerful signal source is needed in order to reach destructive power density levels. The second way is to increase the pulse length of the Marx generator driving the vircator to obtain longer microwave pulses.
However, if the RC test results exhibit an adiabatic part of the Tasca curve for lower pulse lengths, as appears to be the case in Fig. 9, it can be surmised that the same energy level should apply also at shorter pulse lengths, such as the ones achievable in the vircator. This hypothesis needs further studies for verification or discarding. With a high pulse-repetition rate, cumulative heating effects may become important.
The pulse-repetition rate of the vircator is up to 10 Hz, and the intention is to operate the RC at a similar low rate since one focus of the studies is on non-cumulative effects, especially in connection with the ensuing testing of directional sensitivity. However, the RC can operate with a pulse-repetition rate of up to 20 kHz, and this higher repetition rate could be employed in a separate testing of equipment sensitivity to heating effects.
Initial destructive testing of simple electronic systems show that the energy density needed to destroy integrated electronic circuits in the system follow the same basic behavior as could be expected from the Tasca curve.
Tomas Hurtig, Leif Adelöw, Mose Akyuz, Mattias Elfsberg, Anders Larsson and Sten E Nyholm Division of Defence & Security, Systems and Technology FOI – Swedish Defence Research Agency, Sweden